Get in touch with Zejiang Paper Machinery Company


Updated August 2026
Stock preparation process steps are the sequence of mechanical operations, pulping, screening, cleaning, refining, and thickening, that convert raw fiber, virgin wood pulp, recovered paper, or purchased market pulp, into the clean, uniform furnish a paper machine needs to form a defect-free sheet. Not every mill starts from a bale: some buy already-pulped market pulp and skip the raw-material intake stages entirely, while others run a fully integrated line from bale to headbox. The stages below cover the integrated case, with notes on where a purchased-pulp line shortens the sequence. Together, these preparation processes and the stock preparation machines that carry them out are what turn raw cellulose fiber into papermaking-ready furnish.
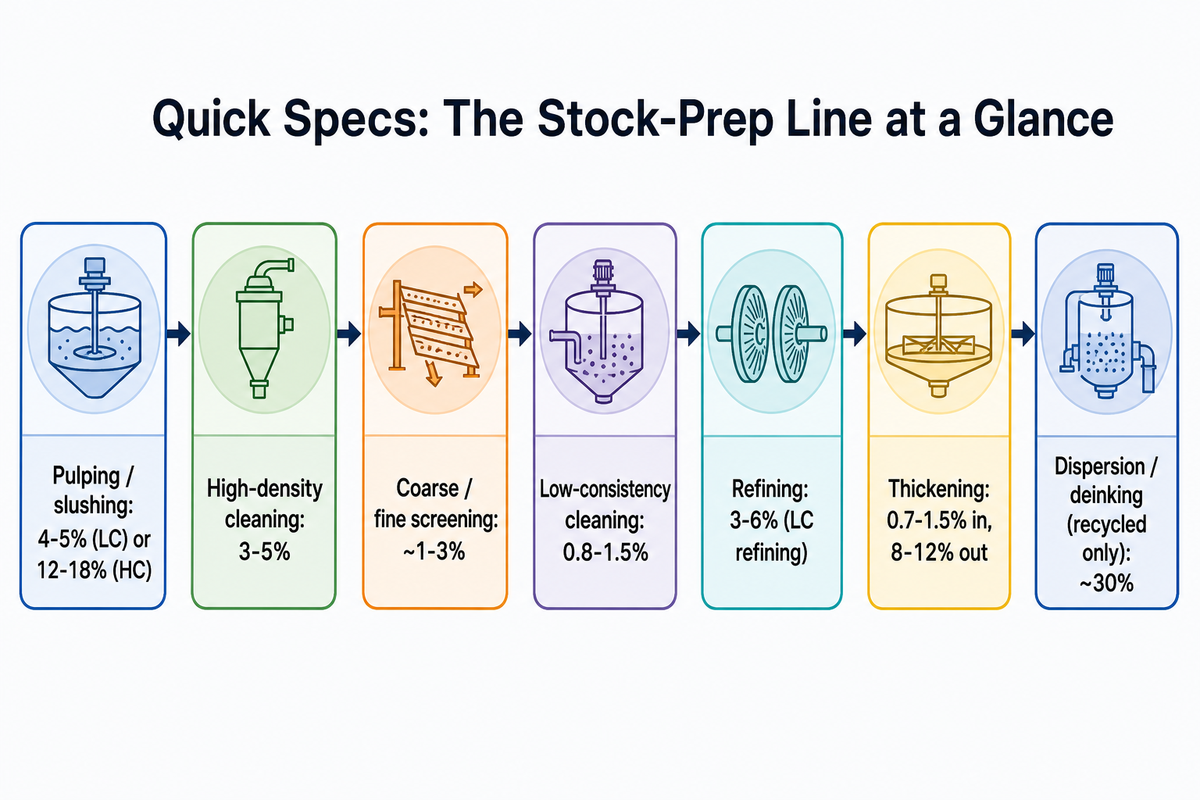
Quick Specs: The Stock-Prep Line at a Glance
Quick Specs
| Stage | Typical Consistency | Primary Equipment |
|---|---|---|
| Pulping / slushing | 4-5% (LC) or 12-18% (HC) | Hydrapulper, drum pulper |
| High-density cleaning | 3-5% | Centrifugal HD cleaner |
| Coarse / fine screening | ~1-3% | Pressure screen, basket + rotor |
| Low-consistency cleaning | 0.8-1.5% | Forward/reverse-flow cleaner |
| Refining | 3-6% (LC refining) | Disc or conical refiner |
| Thickening | 0.7-1.5% in, 8-12% out | Disc filter, gravity thickener |
| Dispersion / deinking (recycled only) | ~30% | Hot disperser, flotation cell |
Every stage above is real process equipment that removes a specific contaminant type or modifies fibre properties on the way to the complete stock preparation equipment line feeding the paper machine’s approach flow system. Skip or undersize any one stage, a common mistake on tight-budget rebuilds, and the risk shows up downstream as sheet defects or unplanned machine stops, not as an obvious fault at the stage that was actually shorted. The same core sequence applies across paper and board mills in production, whether the end product is packaging grade, tissue, or printing paper.
What Stock Preparation Does, and Where It Stops
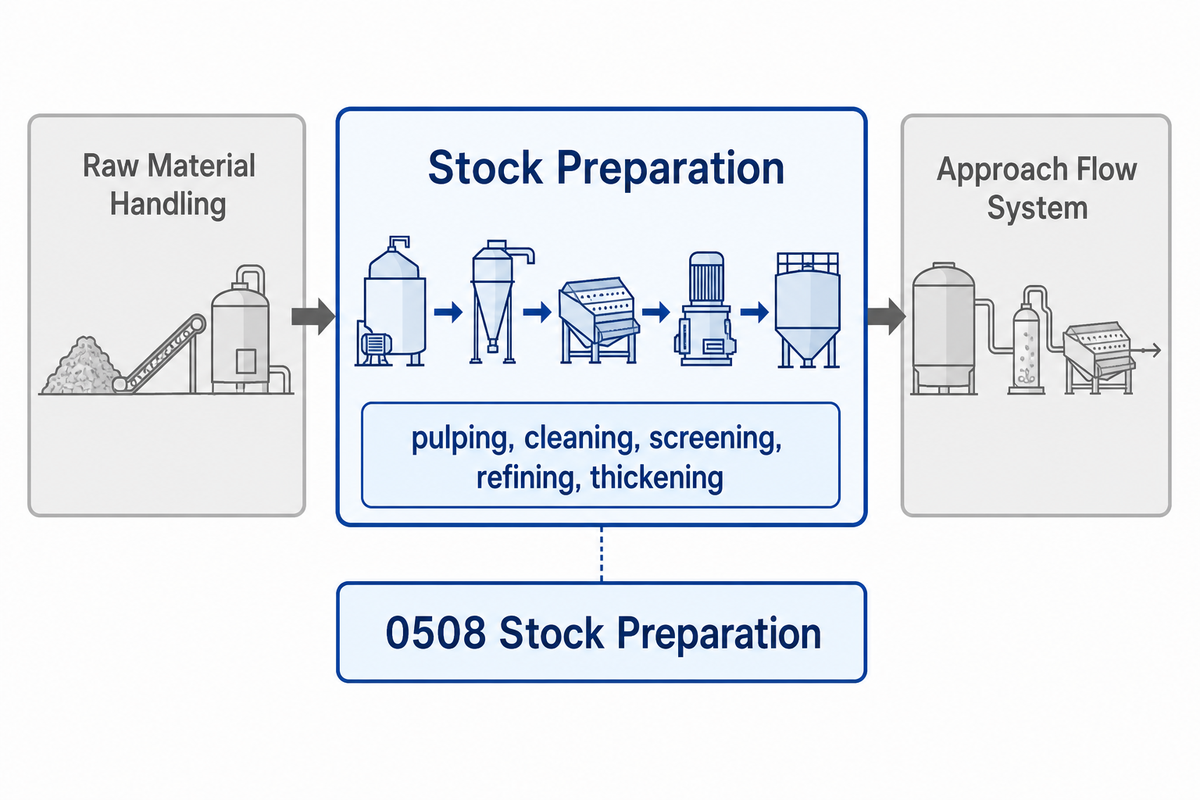
Stock preparation is the sequence of mechanical processes, pulping, cleaning, screening, refining, and thickening, that turn raw fiber into a uniform suspension ready for the approach flow system. It ends where the approach flow system begins, the point where stock is diluted, deaerated, and screened one final time immediately before the headbox.
TAPPI’s own technical classification system lists “0508 Stock Preparation” as a distinct process category from paper machine forming, underscoring that this is a recognized, bounded engineering discipline, not an informal label. In practice, that boundary is also what an OEM uses to scope a stock-prep RFQ correctly, separate from forming-section equipment.
For a recycled-fiber line, the same boundary logic applies with two extra duties folded in: thickening raises consistency by removing carrier water, while deinking, pulping plus screening, flotation, washing, and clarification, is the separate job of detaching and removing ink or contaminant particles. Thickener discharge alone isn’t proof that ink has been removed; the two duties are easy to conflate but structurally distinct.
From Bale to Pulp: Slushing and Initial Defiberizing
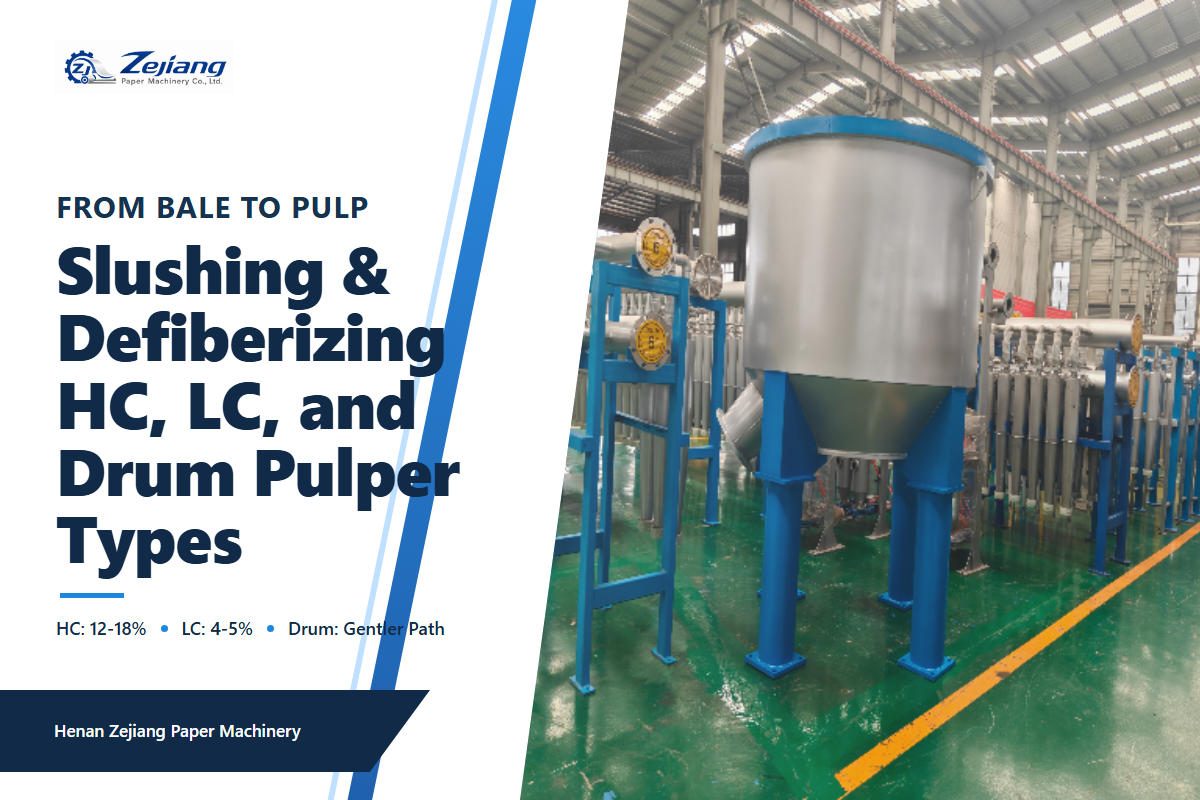
Pulping, also called slushing, or fiber disintegration, breaks raw material into individual fibers by mixing it with water and mechanical agitation. The consistency chosen at this stage sets up everything downstream: high-consistency pulping (roughly 12-18%) is common for waste-paper grades because it keeps contaminants large and intact, making them easier to reject at a screen plate in the pulper base. Low-consistency pulping (around 4-5%) suits cleaner virgin or recycled grades where gentler separation is enough. Drum pulpers offer a gentler middle path for contaminated grades, trading pulping speed for lower fiber damage.
✔ Advantages by pulper type
- High-consistency (HC): rejects large contaminants intact before they fragment
- Low-consistency (LC): gentler on clean virgin fiber, lower energy per ton
- Drum: continuous operation, tolerant of highly contaminated waste paper
⚠ Limitations
- HC pulping needs more installed power per ton than LC
- LC pulping on heavily contaminated furnish lets fragments break down before rejection
- Drum pulpers have a larger footprint than compact vertical pulpers
⚠️ Safety note
Under OSHA 29 CFR 1910.261, any entry into a pulper or beater for cleaning or inspection requires all steam, water, and other control devices to be locked or tagged out first. This applies regardless of which pulper type a line uses, and it’s a real specification consideration, not just a plant-safety footnote, since lockout points and access design vary between vertical, drum, and low-consistency pulper models.
Choosing between a paper pulper machine model comes down to furnish type, contaminant load, and target throughput; a closer look at pulper type selection walks through the trade-offs in more depth.
Deflaking is a related but separate operation, breaking apart surviving fiber bundles into individual fibres without the intensity of full refining. Deflakers are typically installed where pulping alone doesn’t fully disintegrate a difficult furnish; the two-step approach recovers usable fiber from bundles that would otherwise show up as visible specks in the final paper, without subjecting already-good fibers to unnecessary refining energy.
Q: What are the steps involved in stock preparation in paper making?
The sequence runs pulping, high-density cleaning, coarse screening, fine screening, low-consistency cleaning, refining, and thickening, with dispersion and flotation deinking added for recycled graphic-paper grades.
Each stage targets a specific contaminant class or fiber property: pulping liberates fibers from the raw material; high-density cleaning removes heavy debris like sand, glass, and metal by centrifugal force; coarse and fine screening remove progressively smaller shives and fiber bundles; low-consistency cleaning catches fine particles that pass the screens; refining develops fiber bonding strength; and thickening raises consistency for storage or the next process step. A line running on recycled graphic-paper furnish adds a dispersion stage to break down stickies and residual ink into particles too small to see in the finished sheet, followed by flotation deinking to remove ink through air-bubble attachment.
Screening and Cleaning: Removing Contaminants Without Losing Fiber
Screening and cleaning remove different contaminant (impurity) classes by different physical mechanisms, and the order matters. Screening uses a perforated or slotted basket to reject material by size and shape: plastics, tape, shives, and oversized fiber bundles. Cleaning uses centrifugal force in a conical chamber, sometimes called a hydrocyclone in equipment catalogs, to reject material by density: sand, glass, and metal move to the outer wall and exit through a reject port while lighter fiber exits from the top. Well-designed cleaning stages also support fiber recovery, pulling usable fiber back out of the reject stream rather than sending it straight to waste.
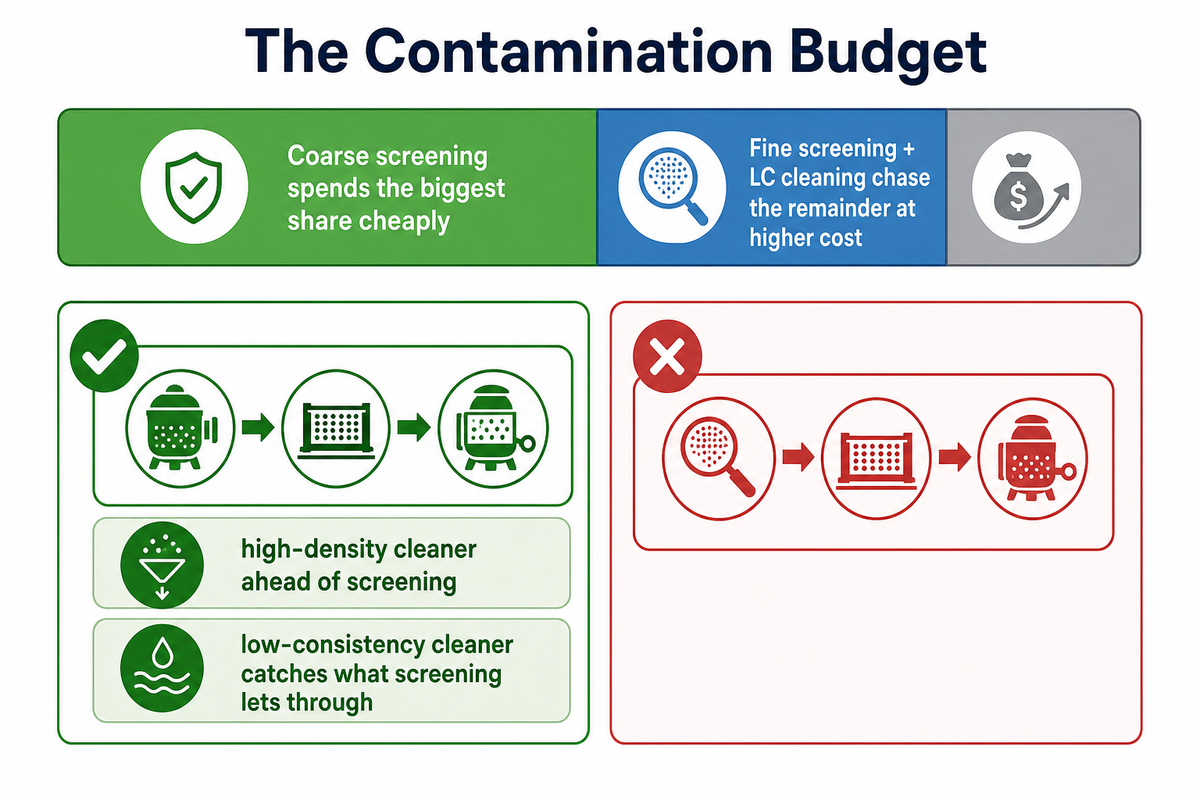
The Contamination Budget: think of each screening and cleaning stage as spending down a fixed “budget” of allowable contaminant load before it compounds into a refining or quality problem downstream. Coarse screening spends the biggest share of that budget cheaply — removing large debris before it can fragment into thousands of smaller particles that fine screening and low-consistency cleaning then have to chase individually. Running fine screening before coarse screening, or skipping a cleaning stage to save capital cost, doesn’t eliminate contaminant load; it just moves the spending to a more expensive, harder-to-control stage further down the line.
A pressure screen for pulp screening handles the size-based rejection; a paper mill cleaner handles the density-based rejection. Most lines need both, and the sequence runs cleaning-screening-cleaning rather than one stage standing in for the other: a high-density cleaner ahead of screening pulls out heavy debris first, coarse and fine screening remove shives and oversized bundles next, and a low-consistency cleaner catches what screening lets through.
Refining: Developing Fiber Bonding Strength and Paper Quality
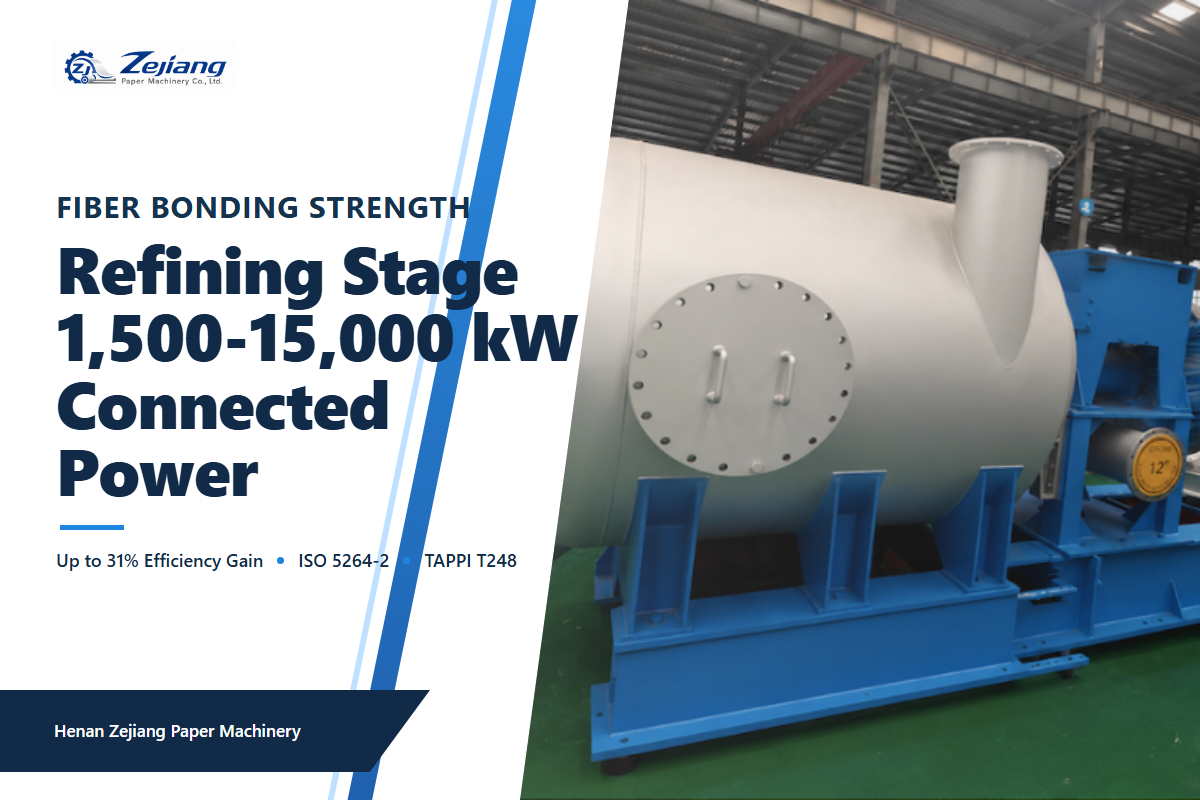
Refining mechanically treats fibers to increase their flexibility, surface area, and bonding potential, which is what ultimately gives paper its tensile strength, burst strength, tear resistance, and other strength properties, as well as the paper machine runnability that keeps a mill’s downstream fiber preparation investment from being wasted on a sheet that breaks on the machine. Most paper mills’ connected refining power falls between 1,500 and 15,000 kW, and refining is consistently one of the most energy-intensive single processes in the mill.
But refining energy and paper strength aren’t simply proportional; pushing more energy into refining doesn’t reliably buy more strength. Peer-reviewed testing has shown that refining consistency and refining intensity jointly determine the outcome: at lower refining consistency, the same specific energy input produces harsher treatment per fiber, and conditions that are too harsh shorten fibers and can reduce the finished paper’s tensile index even though more energy went in. Refining intensity has to be matched to consistency, not maximized in isolation.
⚠️ Where refining commonly goes wrong
Industry case-study data documented at TAPPI’s PaperCon conference found that as much as 70% of the fibers passing through a refiner may not be meaningfully treated at all, while the remaining fibers are over-treated; over-refining, not under-refining, is the more common practical failure mode.
The same case-study set documents real fixes with measured results: one mill converted a double-disc refiner from mono-flo to duo-flo hydraulic flow and measured an 18.5% demand reduction, saving more than 250 MWh per year against a $35,000-75,000 conversion cost with a payback under three years. A second mill upgraded to a splined rotor and cut refiner draw from 580 kW to 400 kW, a 31% reduction, for a $160,872 project that saved $183,825 per year, paying back in under 11 months. These are 2011-vintage case studies, cited here as durable engineering examples rather than current pricing, but the underlying physics, that refining efficiency has real, measurable headroom in most existing lines, still holds.
Refining performance is formally evaluated using standardized methods ISO 5264-2 and TAPPI T248, the PFI Mill method, which remain the current cited standards in 2025 peer-reviewed literature. A disc refiner in stock prep is the most common configuration for this stage; see how a disc refiner works for the mechanism in more detail.
Thickening, Blending, and the Handoff to the Approach Flow System
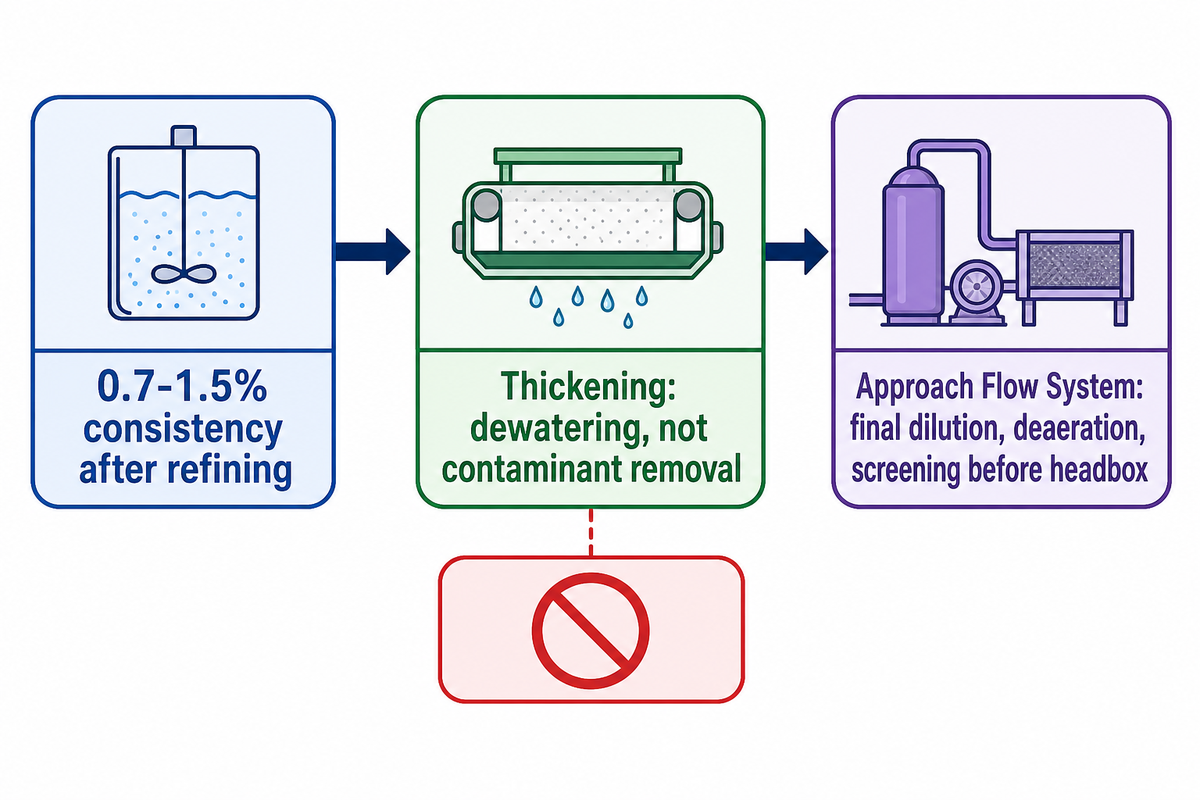
After refining, stock is typically at a low consistency (0.7-1.5%) and needs thickening before storage or the next process step. Thickening equipment, disc filters, gravity thickeners, raises consistency primarily through dewatering, removing carrier water, not by removing contaminants; that distinction matters because it’s tempting to assume a thickened, dewatered stream is automatically a “cleaner” stream, which it isn’t.
Where thickening sits in the line isn’t fixed. Its position depends on the next process duty, the furnish being run, water routing, and how filtrate is handled downstream; the same equipment can sit in a different spot in the sequence depending on those conditions and the specific application, so a single universal flow diagram won’t describe every mill correctly in practice. Once stock is blended to a uniform fibre suspension, it hands off to the wet-end approach flow system: the final dilution, deaeration, and screening stage immediately before the headbox, where the mill has almost no margin left for consistency drift, any variation introduced here shows up directly as sheet variation. This is one of the costliest mistakes to trace after the fact, because the symptom (basis-weight streaks, formation defects) appears on the paper machine while the root cause sits one or two stages upstream in stock prep.
Downstream equipment selection for this stage depends on furnish type and water-loop conditions; see the pulp thickener and deinking equipment line for configuration options.
Consistency and Furnish Control: What Operators Actually Adjust
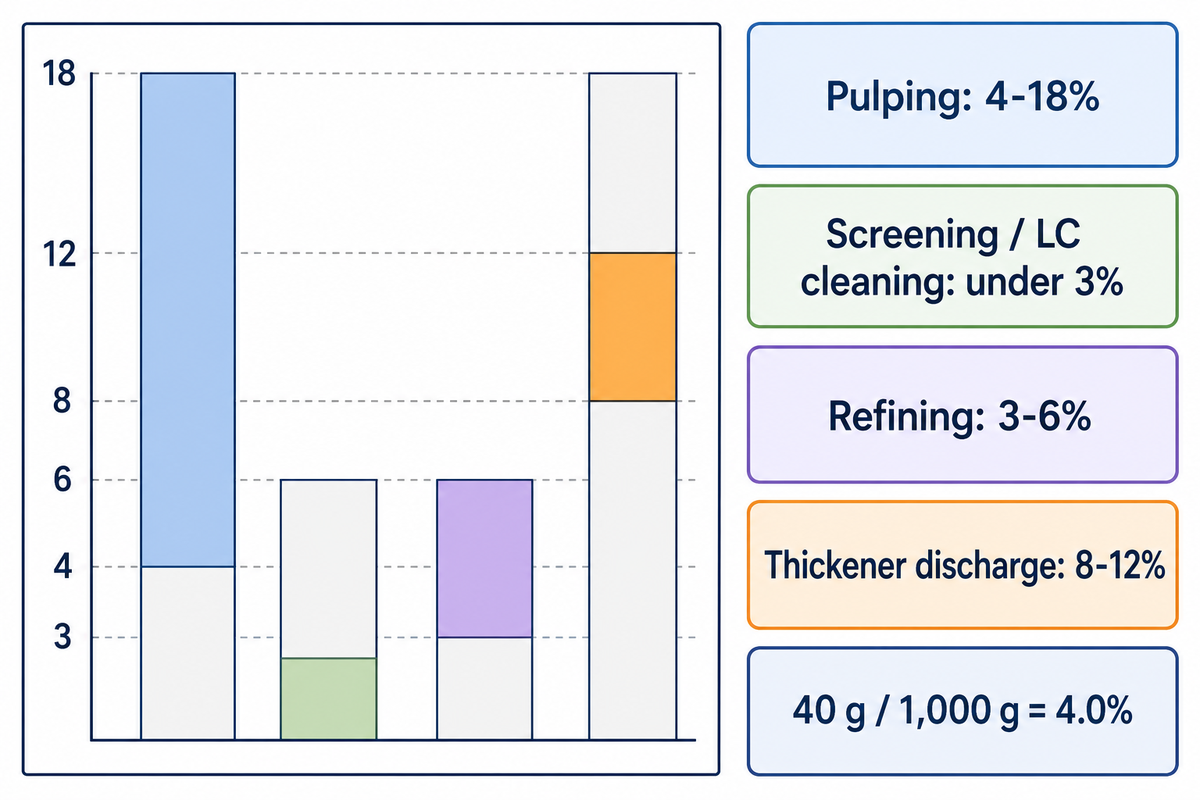
Consistency is the percentage of oven-dry fiber mass in a stock suspension, calculated as oven-dry fiber mass divided by total suspension mass. A worked example: if a sample of stock suspension weighs 1,000 g total and contains 40 g of oven-dry fiber once the water is driven off, consistency is 40 ÷ 1,000 = 4.0%. That single number is what operators dial in at every stage, pulping around 4-18% depending on pulper type, screening and low-consistency cleaning under 3%, refining typically 3-6%, thickener discharge 8-12%.
Higher consistency isn’t automatically better. In one documented chemical deinking trial, raising consistency from 6% to 10% improved processing results, but pushing further to 12% made results worse; consistency has a real optimum, not a “more is always better” relationship, and that optimum shifts with furnish and process chemistry.
💡 Pro Tip
Consistency percentage alone doesn’t capture everything in the suspension. TAPPI/ANSI T240 defines consistency by oven-dry matter, but the same suspension can carry fillers, additives, and dissolved and colloidal substances that a consistency reading won’t show, and those substances are a documented cause of deposits, felt filling, sheet spots, and web breaks that consistency control alone won’t catch or explain.
Q: How do you control consistency in stock preparation?
Operators control consistency by adjusting dilution water at each stage transfer point, using consistency transmitters as feedback, and holding each stage within its target range rather than treating consistency as a single mill-wide setpoint.
Because each stage, pulping, screening, refining, thickening, has its own target consistency band, control happens locally at stage transfers, not globally. Dilution water is added or withheld at chest transfers to hit the target band for the next stage; in-line consistency transmitters feed that adjustment. Because the relationship between consistency and process outcome isn’t strictly linear (as the refining and deinking examples above show), operators generally hold within a proven working range for their furnish rather than chasing a theoretical maximum, and revalidate that range whenever furnish composition changes materially.
Where Stock Prep Breaks: Common Failure Points and Diagnosis
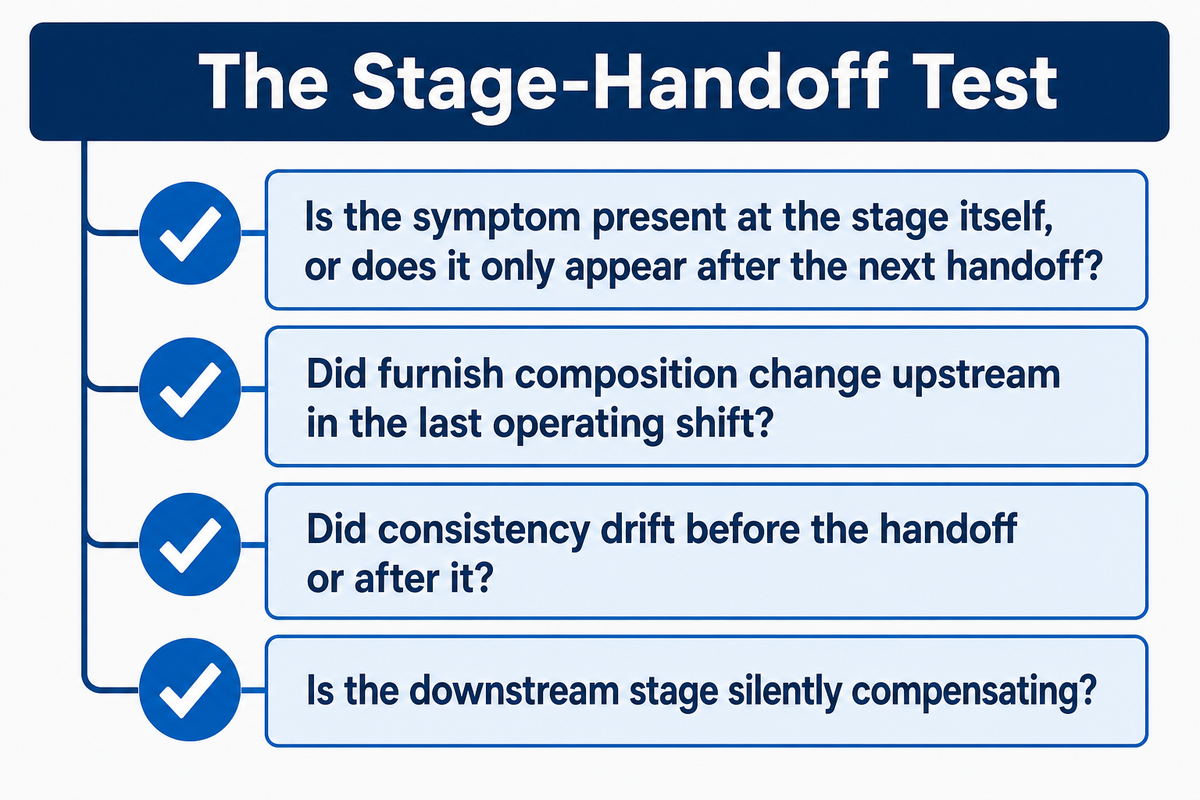
Refiner plate condition alone can account for a large share of a mill’s process-related energy variation, and it’s an easy thing to overlook because plate wear degrades gradually rather than failing outright. But in practice, a symptom showing up at one stage often traces back to a change that happened at the previous stage’s handoff, not a fault within the stage itself.
A screen that starts blinding faster than usual, for example, may be reacting to a pulper consistency drift upstream, not a screen problem at all.
We use a simple diagnostic method for sorting this out before assuming a component has failed. This is our own field-logic framework, not a cited industry statistic: no published data quantifies what share of stock-prep failures originate at handoffs versus within a single stage, so treat it as a troubleshooting method to try, not an established ratio.
The Stage-Handoff Test (4 Questions Before You Open Anything Up)
- ✔ Is the symptom present at the stage itself, or does it only appear after the next handoff?
- ✔ Did furnish composition change upstream in the last operating shift?
- ✔ Did consistency drift before the handoff or after it?
- ✔ Is the downstream stage silently compensating (running harder, using more dilution water) rather than showing an obvious fault?
Working through these four questions before opening up a component for inspection often narrows a fault to a handoff condition, a furnish change, a consistency drift, a water-routing adjustment made elsewhere, rather than a genuine mechanical failure, which changes what gets serviced and how fast.
| Symptom | Likely Root Cause | Diagnostic Check | Corrective Action |
|---|---|---|---|
| Screen blinding faster than the usual cycle | Pulper consistency drifted upstream in the last shift, not a screen fault | Pull the consistency transmitter trend at the pulper for the prior shift | Correct pulping consistency at the source before servicing the screen |
| Refiner power demand creeping up with no throughput change | Gradual refiner plate wear, easy to overlook because it degrades slowly | Track refiner draw (kW) against production rate over weeks, not one shift | Schedule plate inspection/replacement instead of assuming a drive fault |
| Fine screening or low-consistency cleaning running an unusually high reject rate | Coarse screening stage under-sized or skipped, pushing its contaminant budget downstream | Audit reject load at each screening/cleaning stage in sequence | Confirm staging order runs coarse before fine, per the Contamination Budget logic |
| Paper strength below target despite more refining energy applied | Over-refining, not under-refining — case-study data shows up to 70% of fibers can pass through under-treated while others are over-treated | Check refining consistency against intensity setpoint jointly, not energy input alone | Match intensity to consistency instead of adding more power |
| Tensile index drops after a refining change | Refining consistency too low for the intensity applied, over-shortening fibers | Compare the actual refining consistency reading against the 3-6% working band | Raise refining consistency or reduce intensity, not both blindly |
| Downstream defects continue after the stock reads “cleaner” post-thickening | Thickening dewaters (removes carrier water) but does not remove contaminants | Compare contaminant/reject counts immediately before and after thickening — they should be near-identical | Trace the contaminant back to screening/cleaning, not the thickener |
| Sheet variation at the reel with no obvious upstream fault logged | Consistency drift at the approach flow system, the stage with almost no margin left before the headbox | Check the approach-flow consistency transmitter for drift immediately pre-headbox | Tighten dilution water control at that final handoff first |
| Deposits, felt filling, or sheet spots despite consistency reading in range | Fillers, additives, and dissolved/colloidal substances that a T240 consistency reading doesn’t capture | Run a furnish composition/chemistry check beyond the consistency percentage | Address via furnish/chemistry control, not the consistency loop |
| Deinking or cleaning results get worse after raising consistency further | Consistency pushed past this furnish’s real optimum (one documented trial got worse going from 10% to 12%) | Compare the current setpoint against the previously validated working range for this furnish | Back off to the proven range and revalidate only after a real furnish change |
| A stage is running harder or using more dilution water with no fault logged anywhere | The stage is silently compensating for an upstream problem instead of showing an obvious fault | Run the Stage-Handoff Test’s four questions before opening up any component | Trace to the handoff condition, furnish change, or consistency drift the compensation is masking |
Virgin vs Recycled Fiber Stock Prep: What Changes
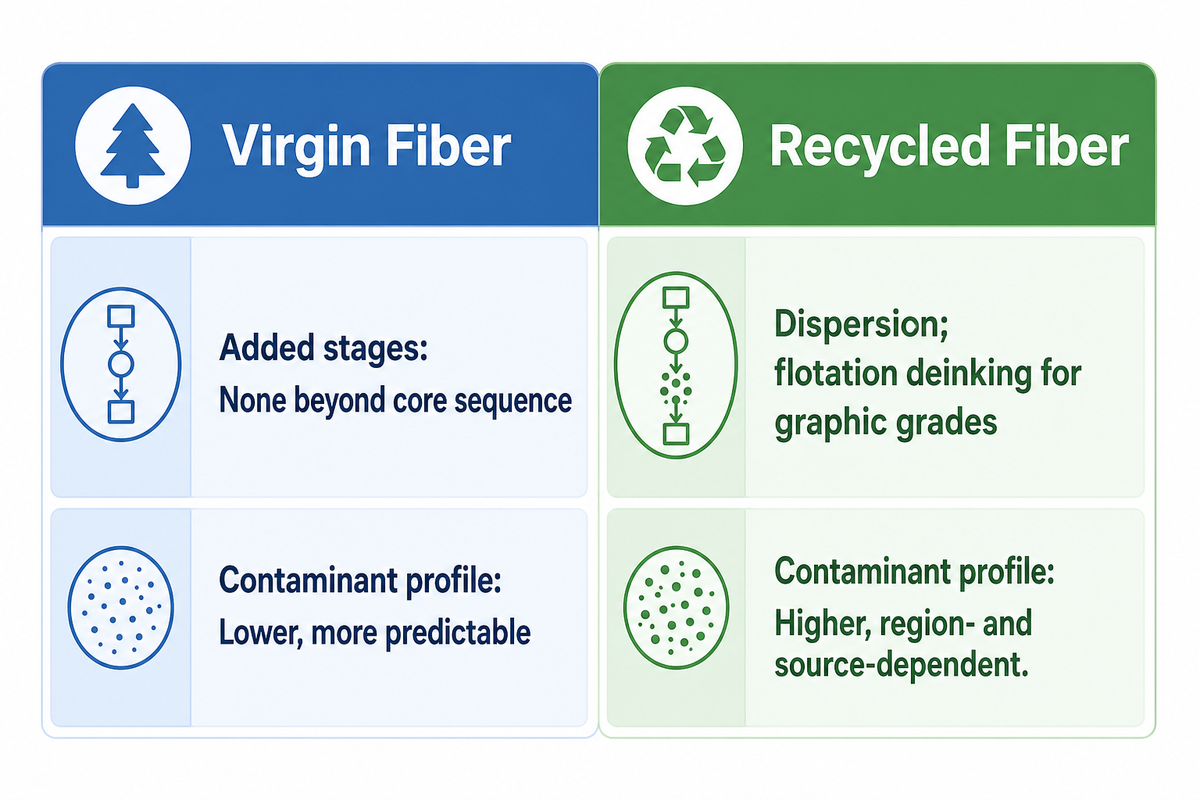
Recycled-fiber lines need stages a virgin-fiber line doesn’t: dispersion, to break stickies and residual ink into particles too small to see in the finished sheet, and flotation deinking for graphic-paper grades, to remove ink through air-bubble attachment. That much is a straightforward addition of unit operations for the application at hand.
What’s less intuitive is the energy direction. More stages don’t mean more total energy. Recycled pulping avoids wood preparation and most chemical pulping stages entirely, so total process energy per tonne is typically lower, a 2025 peer-reviewed literature review reports published life-cycle assessments putting recycled grades at roughly 20% to 60% lower process energy than virgin equivalents, with the lower end applying to streams that need dispersion and deinking, the graphic-paper case this section covers, and the upper end reserved for deinking-free streams like OCC packaging grades. Broader industry accounts cite 60-70% less energy and water overall for recycled paper in general. Treat any single precise percentage as directional, not a number to spec against, since results vary by pulp grade, deinking requirements, and what’s counted inside the study boundary. What’s consistent across every comparison is the underlying reason: recycled lines skip the most energy-intensive step in the virgin chain, cooking raw wood into pulp in the first place. The extra dispersion and deinking stages add real processing steps and real capital cost, but they don’t reverse the overall energy advantage recycled fiber starts with. Mills often make the opposite budgeting assumption on a recycled-fiber conversion, over-forecasting energy costs while under-forecasting the added contaminant-handling equipment they actually need, a mistake worth catching at the RFQ stage, not after commissioning.
| Factor | Virgin Fiber | Recycled Fiber |
|---|---|---|
| Added stages | None beyond core sequence | Dispersion; flotation deinking for graphic grades |
| Overall production energy | Higher (includes upstream pulping/cooking) | Lower — roughly 20-60% less process energy per 2025 literature review (lower end for deinking-required grades) |
| Contaminant profile | Lower, more predictable | Higher, region- and source-dependent |
This article stays at the process-boundary level; for the deinking and dispersion mechanics themselves, see recycled fiber deinking process, and for equipment options, the pulp thickener and deinking equipment line.
Why Fewer New Paper Machines Means More Stock-Prep Upgrades
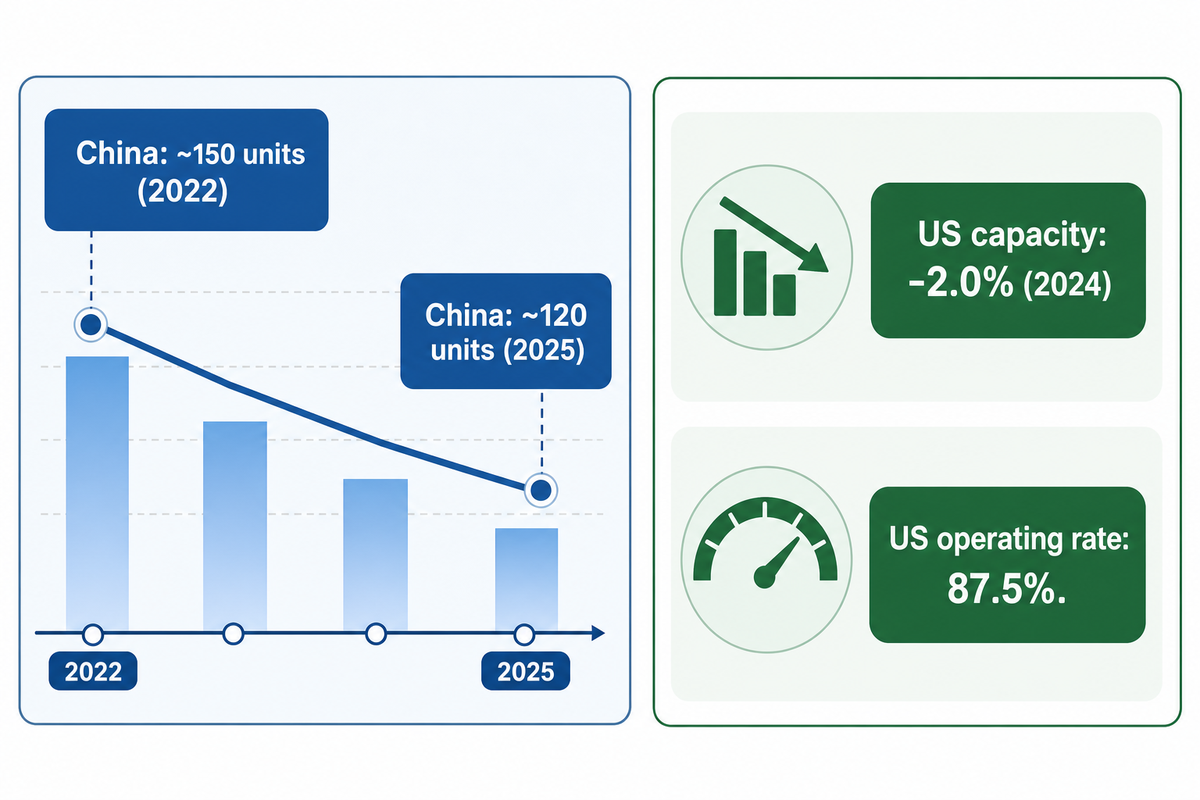
New paper machine installations in China, still the world’s largest concentration of paper machinery manufacturing and installation, peaked at around 150 units in 2022, declined to about 120 in 2025, and are expected to fall further. That trend is corroborated at the national level in the US.
The American Forest & Paper Association’s 2025 capacity survey reports US paper and paperboard capacity fell 2.0% in 2024, an accelerating decline against a 0.9% average annual rate since 2015, even as the industry’s operating rate climbed to 87.5%.
“More capacity has been removed resulting from investments in mill system modernization and streamlining of businesses,” not simply idled. — American Forest & Paper Association, 2025 capacity survey
The shift toward upgrading rather than replacing is driven by that same decline in new-build volume: mills are running existing assets harder and investing in modernizing what they’ve got rather than commissioning full new machines. For a stock-prep line specifically, that means the practical question shifts from “what new machine should we buy” to “what in our existing line is worth upgrading” — which is also where power, water, footprint, automation, and control-system compatibility with the rest of the mill become real constraints, not just line-item specs on a datasheet. Buyers who default to a full-line replacement quote without first auditing which stages are actually the bottleneck routinely overpay for capacity they don’t need; a supplier that can quote both new and rebuilt equipment, as we do, can price a targeted upgrade against a full replacement so the mill sees the real tradeoff instead of one option.
How to Evaluate a Stock-Prep Line or Upgrade
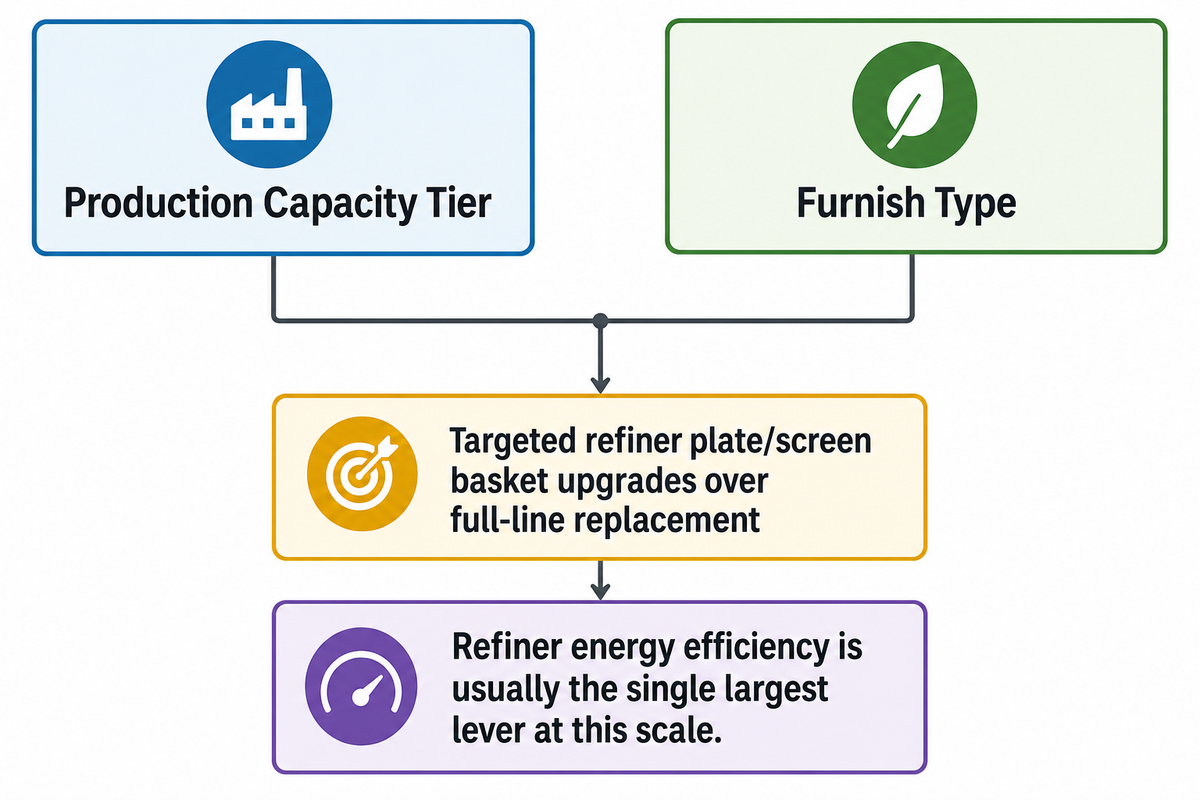
Before comparing quotes, the decision usually comes down to two variables: production capacity tier and furnish type.
| Capacity Tier | Furnish Type | Configuration Emphasis |
|---|---|---|
| <50 TPD | Virgin | Targeted refiner plate/screen basket upgrades over full-line replacement |
| <50 TPD | Recycled / OCC | Add dispersion capacity before enlarging cleaning stages |
| 50-100 TPD | Virgin | Refiner efficiency retrofit (duo-flo conversion, splined rotor) usually pays back fastest |
| 50-100 TPD | Recycled / OCC | Cleaning and screening capacity typically the binding constraint, not refining |
| 100-300 TPD | Virgin | Full-line energy audit before committing capital to any single stage |
| 100-300 TPD | Mixed / OCC | Add or upgrade dispersion and cleaning capacity before touching refining |
| 100-300 TPD | Heavy-contaminant recycled | Prioritize multi-stage cleaning and deinking over refiner upgrades |
| >300 TPD | Virgin | Refiner energy efficiency is usually the single largest lever at this scale |
| >300 TPD | Recycled / OCC | Full-line audit; thickening throughput and dispersion capacity join refining as major levers |
RFQ checklist — copy these into your quote request:
| Parameter | What to specify | Why it matters | How to verify |
|---|---|---|---|
| Furnish composition | Virgin/recycled/mixed ratio, fiber source | Drives pulper type and added-stage requirements | Furnish audit over a representative production window |
| Target flow & consistency by stage | Inlet/target consistency at each transfer point | Sizes pumps, chests, and refiner loading | In-line consistency transmitter logs |
| Contaminant profile | Size classes and load by contaminant type | Sizes screening/cleaning stage count | Reject sampling at existing cleaning stages |
| Water-loop conditions | Filtrate handling, closure level | Affects thickening/approach-flow integration | Water balance audit |
| Quality targets & symptoms | Strength/formation targets, current defect symptoms | Anchors refining and screening spec to real outcomes | Lab test data + quality log history |
| Upstream/downstream constraints | Power, footprint, PLC/control compatibility | Determines whether a targeted upgrade or full-line replacement fits | Site engineering walk-down |
Documenting these six items before requesting quotes, rather than starting from a catalog spec sheet, is what separates a stock-prep upgrade that actually fixes a mill’s real bottleneck from one that just swaps equipment without changing the outcome. Ready to move from evaluation to a quote? RFQ readiness checklist walks through the same fields in submission-ready form. For the transfer-pump portion of that request, compare industrial pumps from BBP against the specified flow, head and stock consistency, with fiber handling and impeller passage confirmed for the actual duty.
Explore Complete Stock Preparation Systems →
FAQ
Q: What is stock preparation in a paper mill?
Stock preparation is the sequence of mechanical processes that convert raw fiber into a clean, uniform suspension ready to feed a paper machine’s approach flow system.
It covers pulping, cleaning, screening, refining, and thickening as a bounded process stage, distinct from both the raw-material handling that precedes it and the paper machine forming section that follows. TAPPI’s technical classification lists it as “0508 Stock Preparation,” a recognized category separate from paper machine forming. A recycled-fiber line adds dispersion and flotation deinking to the same core sequence.
Q: What are the steps involved in stock preparation in paper making?
Pulping, high-density cleaning, coarse and fine screening, low-consistency cleaning, refining, and thickening make up the fixed staged sequence, with dispersion and deinking added only for recycled graphic-paper grades.
See the step-by-step breakdown above for what each stage removes or modifies, and where equipment choices diverge by furnish type.
Q: How are contaminants removed during stock preparation?
Screening removes contaminants by size and shape through a perforated or slotted basket; cleaning removes contaminants by density through centrifugal force in a conical chamber; most lines need both, staged with a high-density cleaner ahead of screening and a low-consistency cleaner after it.
Screening catches plastics, tape, shives, and oversized fiber bundles. Cleaning catches sand, glass, and metal; heavier particles move to the outer wall of the cleaner and exit through a reject port. Running fine screening before coarse screening, or skipping either a cleaning or screening stage, shifts unremoved contaminant load onto later, more expensive stages rather than eliminating it.
Q: What equipment is used in a stock preparation line?
Pulpers, high-density cleaners, pressure screens, low-consistency cleaners, disc or conical refiners, and thickening equipment cover the core line, plus dispersers and flotation cells for recycled-fiber lines.
See the Quick Specs table above for the full stage-by-stage equipment list and typical consistency ranges.
Q: What is the difference between stock preparation and pulp preparation?
The terms are often used interchangeably, but “pulp preparation” technically refers only to the fiber-liberation (pulping) stage, while “stock preparation” covers the full sequence from raw material through refining and thickening to headbox-ready furnish.
In day-to-day mill conversation the distinction is rarely enforced strictly, and most engineers use “stock preparation” to mean the complete system. Where the distinction matters is in equipment specification and RFQ scoping: a “pulp preparation” quote from a supplier may cover only the pulper and initial cleaning, while a “stock preparation” quote should cover the full line through thickening. Confirming which scope a quote actually covers avoids a mismatch discovered only after the equipment arrives; ask explicitly whether refining and thickening equipment are included, not just implied by the section header on a spec sheet.
Q: How much energy does stock preparation consume?
Refining is typically the single largest energy consumer in stock preparation, with most mills’ connected refining power falling between 1,500 and 15,000 kW, and documented retrofits have cut that draw by 18-31% in real case studies.
Exact consumption varies by furnish, target paper grade, and refining intensity, so a precise mill-wide figure isn’t meaningful without those specifics. What is well documented is the improvement headroom: hydraulic-path conversions and rotor upgrades in published case studies delivered 18.5% to 31% demand reductions, with paybacks under 11 months in the fastest documented case and under three years in the slowest, evidence that most existing lines have real, measurable energy efficiency left on the table, not that a single number applies mill-to-mill.
About This Analysis
This guide draws on TAPPI conference case-study data, EPA and OSHA regulatory references, peer-reviewed refining research, and Henan Zejiang’s own equipment-line design experience across virgin-fiber, OCC, and mixed-furnish stock preparation systems built for mills exporting across Asia, the Middle East, Africa, and South America. Where a claim rests on a single source rather than cross-verified data, we’ve said so directly rather than presenting it with false precision.
References & Sources
- Wroblewski, “Energy Efficiency Frontier, Lean and Green Refining,” TAPPI PaperCon 2011 Focus on Energy
- TAPPI Standards and Guidelines, TIP 0508 Stock Preparation classification TAPPI
- Stock Prep/Refining Facilities University of Maine Process Development Center
- 29 CFR 1910.261, Pulp, Paper, and Paperboard Mills U.S. Occupational Safety and Health Administration
- AF&PA Details U.S. Paper Production and Capacity Trends American Forest & Paper Association, 2025
- Pătrăucean-Patrașcu, Gavrilescu & Gavrilescu, “Chemical Transformations and Papermaking Potential of Recycled Secondary Cellulose Fibers for Circular Sustainability,” Applied Sciences 15(24), 2025 MDPI — primary source for the recycled-vs-virgin process-energy range cited above
- Ang, Haritos & Batchelor, “Cellulose Nanofibers from Recycled and Virgin Wood Pulp: A Comparative Study of Fiber Development,” Carbohydrate Polymers, 2020 PubMed — background reference on a related but narrower topic (nanocellulose production energy, not general stock-prep energy; not the source for the recycled-energy figures cited above)
- Olejnik, “Impact of Pulp Consistency on Refining Process Conducted under Constant Intensity Determined by SEL and SEC Factors,” BioResources 8(3), 2013
- Pathak, Bhardwaj & Singh, “Optimization of Chemical and Enzymatic Deinking of Photocopier Waste Paper,” BioResources 6(1), 2011
- Global Development Trends of the Paper Industry and Corporate M&A Investment Strategies Amy Chu, ResourceWise (data: FisherSolve)
- WO2024141707A1, A SCK Paper Comprising BCTMP and Recycled Pulp patents.google.com, 2024


![Refiner Plates & Screen Baskets [Complete Guide]](https://zjpapermachine.com/wp-content/uploads/2026/07/refiner-plates-screen-baskets-guide-featured-150x150.png)
![Doctor Blade: Types, Materials & How It Works [Guide]](https://zjpapermachine.com/wp-content/uploads/2026/07/doctor-blade-guide-featured-1-150x150.png)
![Pulping Equipment: How Paper Pulping Works [Guide]](https://zjpapermachine.com/wp-content/uploads/2026/07/pulping-equipment-guide-featured-150x150.png)