
Get in touch with Zejiang Paper Machinery Company


Paper mill capacity calculation is the process of turning a machine’s trim width, running speed, and basis weight into a realistic daily or annual tonnage figure. It starts with three physical numbers you already have on a machine’s spec sheet, trim width, running speed, and basis weight, but the figure most buyers actually need isn’t what those three numbers multiply out to. It’s that raw number after a handful of real-world discount factors have been applied. This primer walks through the formula for calculating the capacity of a paper machine, a worked example with real numbers, the realistic ranges for each input, and the mistakes that turn an honest calculation into a misleading one. This is the same core method engineers use for calculating the capacity across almost any grade, from a small specialty line to a large international installation. Updated September 2026.
Quick Specs, What Goes Into a Capacity Calculation
| Trim width | Meters (m) — the usable sheet width at the reel |
| Machine speed | Meters per minute (m/min) |
| Basis weight (grammage) | Grams per square meter (g/m²), per ISO 536 |
| Operating-hours ratio | Share of calendar time actually running |
| Machine efficiency | Share of running time producing on-spec sheet |
| Finished-product yield | Share of on-spec sheet that ships as saleable product |
What Paper Mill Capacity Actually Means
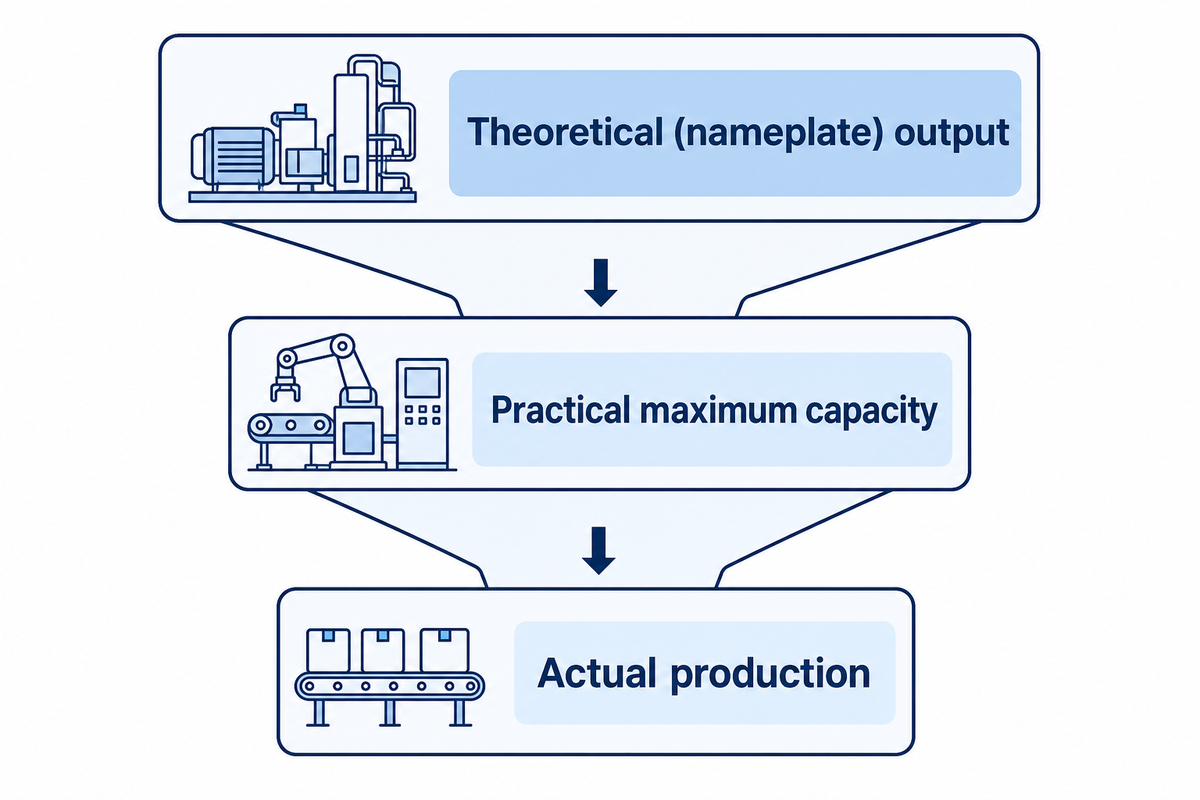
Paper mill capacity isn’t one number, it’s at least three different numbers that get called “capacity” interchangeably, and mixing them up is the single most common source of a bad estimate. In its official pulp-and-paper capacity surveys, the UN Food and Agriculture Organization draws a hard line between them: theoretical (nameplate) output is what the width-speed-weight math produces with zero losses, while practical maximum capacity is a defined, narrower term:
“The tonnage of paper, paperboard or pulp of normal commercial quality that could be produced per year with full use of equipment and adequate supplies of raw materials and labour, assuming full demand” — a definition that explicitly excludes losses from unscheduled shutdowns, strikes, or power interruptions.
— UN Food and Agriculture Organization, World Surveys of Pulp and Paper Capacity and Production
Actual production is a third, still-narrower figure: what really ships once every real-world disruption is included. A supplier’s marketing number is almost always the first tier. A buyer’s real planning number needs to be closer to the third — and a costly RFQ sized off the wrong tier is the single most avoidable mistake in this entire process.
The scope here is paper-machine throughput capacity specifically, the forming, pressing, and drying sections that turn stock into a reel of paper. That’s usually the bottleneck that defines overall mill capacity, but a full whole-mill study also has to check upstream stock-preparation and downstream finishing and logistics, since any one of those can become the real constraint on a given line.
One more scoping note, since it matters for anyone comparing this to other capacity content: a cost-planning framework is a different question from a throughput-calculation formula. For example, when project economics are the question rather than the math itself, capacity is usually just one line item among several, grade, new-versus-refurbished equipment, and site utilities all move the number too, and that’s a procurement conversation, not this one.
The Core Paper Machine Capacity Formula and the 3-Input Rule
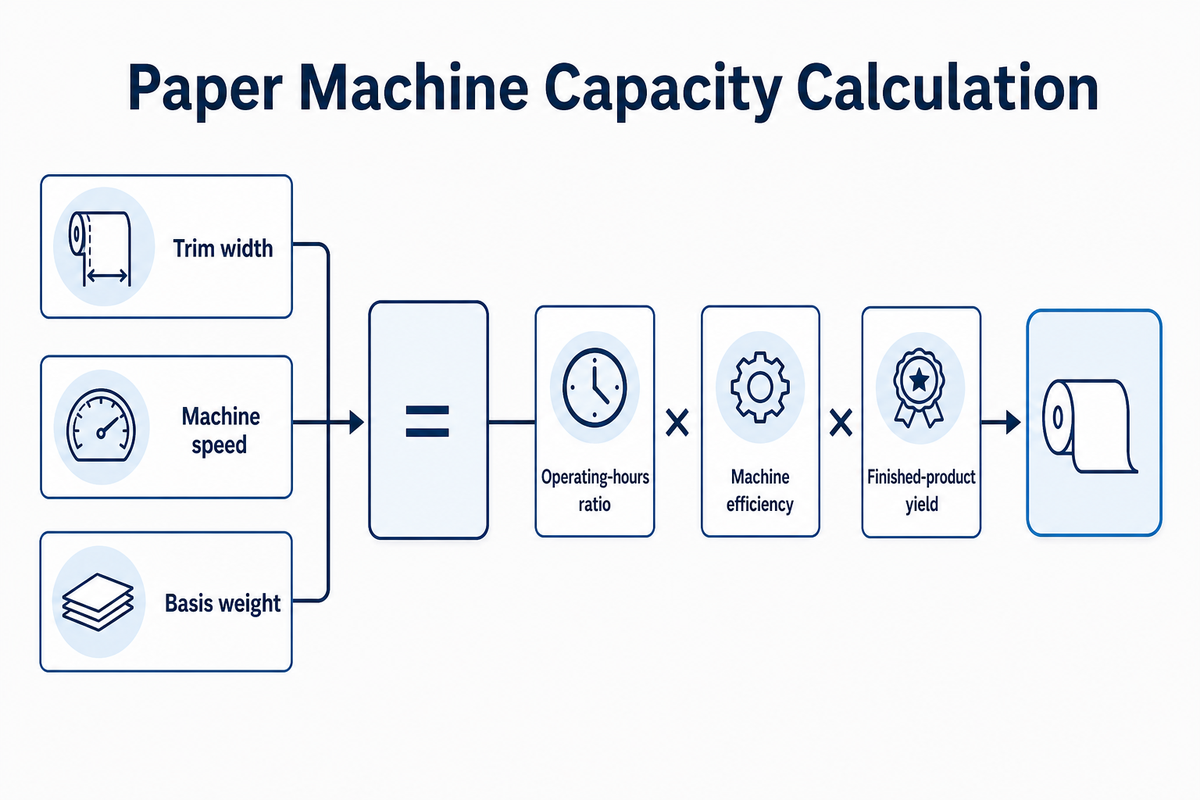
The formula behind almost every paper machine capacity calculation is: daily capacity (tons) equals trim width (m) times machine speed (m/min) times basis weight (g/m²) times operating minutes per day, divided by 1,000,000 to convert grams to tons, then multiplied by an operating-hours ratio, a machine-efficiency factor, and a finished-product-yield factor. The 3-Input Rule is the useful shortcut version of this: you only need three numbers, trim width, speed, and basis weight, to sanity-check any capacity claim a supplier makes, before you even get to the efficiency factors. If a quoted daily-tonnage figure doesn’t roughly match what those three inputs produce, the rest of the quote deserves a second look.
Two independently-operating paper-machine manufacturers publish versions of this exact relationship with different notation but identical underlying physics, one expresses it as an hourly rate with an explicit 0.06 unit-conversion constant (equal to 60 minutes-per-hour divided by 1,000 grams-per-kilogram), the other as a daily-tons formula with the discount factors folded into a single divisor. Both converge on the same math, which is a useful cross-check, but neither cites an external source for the formula, and this is worth knowing before you accept any single vendor’s version as gospel.
📐 Engineering Note
This formula gives a gross theoretical sheet-mass rate — the raw output of width × speed × basis weight — not automatically the net finished tonnage a mill reports. Official capacity surveys report paper and paperboard in metric tons of net finished product, and pulp in air-dry tons at a defined 10% moisture basis. Trim losses, moisture adjustment, and off-spec rejects sit between the gross formula output and that net reported number, which is exactly what the efficiency and yield factors below are trying to capture.
Worked Example: From Machine Numbers to Daily and Annual Production
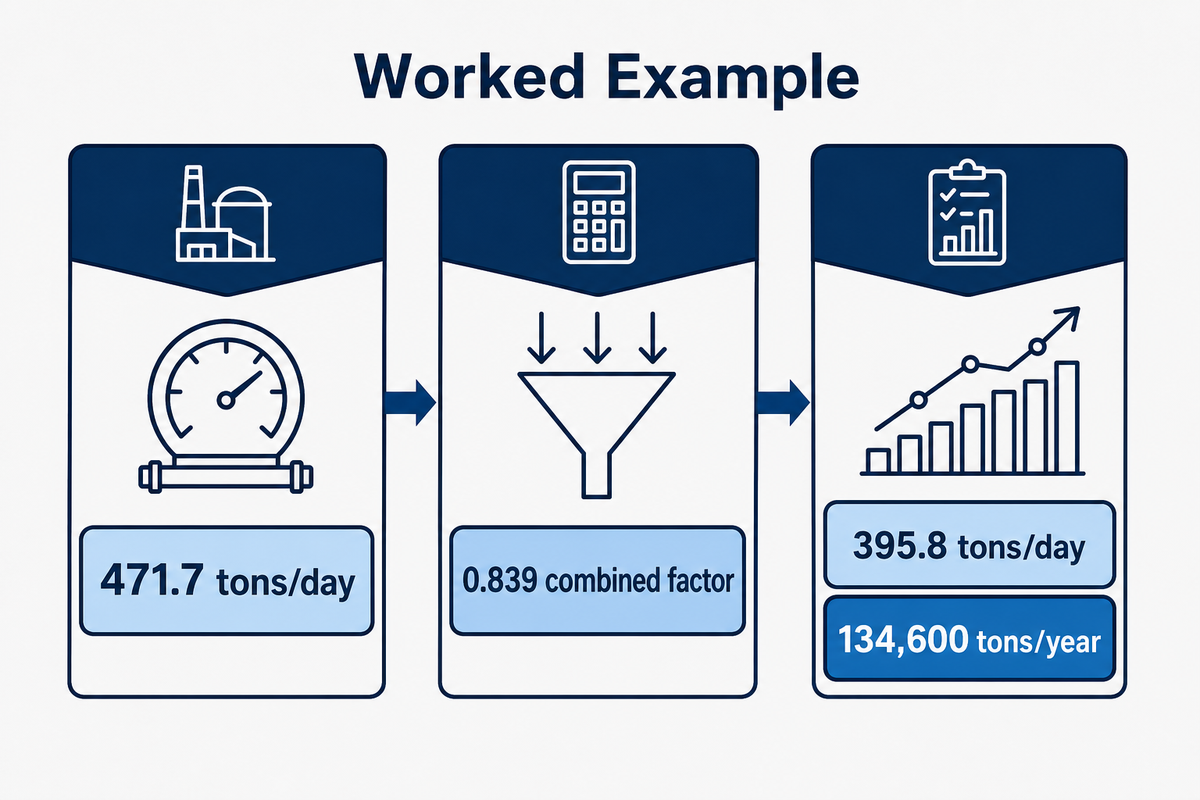
Take a mid-size kraft paper machine running a trim width of 4.2 m at 650 m/min, producing 120 g/m² basis weight. Multiplying those three inputs gives 4.2 × 650 × 120 × 1,440 (minutes/day) ÷ 1,000,000 = 471.7 tons/day of raw sheet-mass output, the gross theoretical rate before any real-world discount is applied. Two independent paper-machine manufacturers publish mathematically-equivalent versions of this same relationship (one as an hourly rate with an explicit unit-conversion constant, the other as a daily-tons formula), which is a useful cross-check that the underlying physics here is standard, not one vendor’s proprietary claim.
Now apply realistic discount factors: a 95% operating-hours ratio (planned maintenance and changeovers), 92% machine efficiency (unplanned stops and quality holds), and 96% finished-product yield (trim and off-spec losses). Multiplying those three factors together (0.95 × 0.92 × 0.96 = 0.839) against the gross rate gives 395.8 tons/day of realistic net output, already 16% below the raw formula number, before a single machine breakdown has happened. That 16% gap is exactly the kind of shortfall that turns an optimistic RFQ into a missed delivery commitment if a buyer plans against the gross number instead of this discounted one.
Annualized at 340 operating days (accounting for roughly 25 days of scheduled downtime across the year), that machine’s realistic annual production comes out to about 134,600 tons/year. Note that this is a single-grade illustration for clarity, since a machine that runs several grades in the same year can’t simply multiply one grade’s daily rate by 365, official capacity methodology apportions a multi-grade machine’s annual capacity according to its actual or planned production time-share across grades, so a mill running 60% kraft and 40% a lighter grade needs a weighted calculation, not this single-grade shortcut.
Basis Weight (GSM): the Input That Swings Your Number the Most
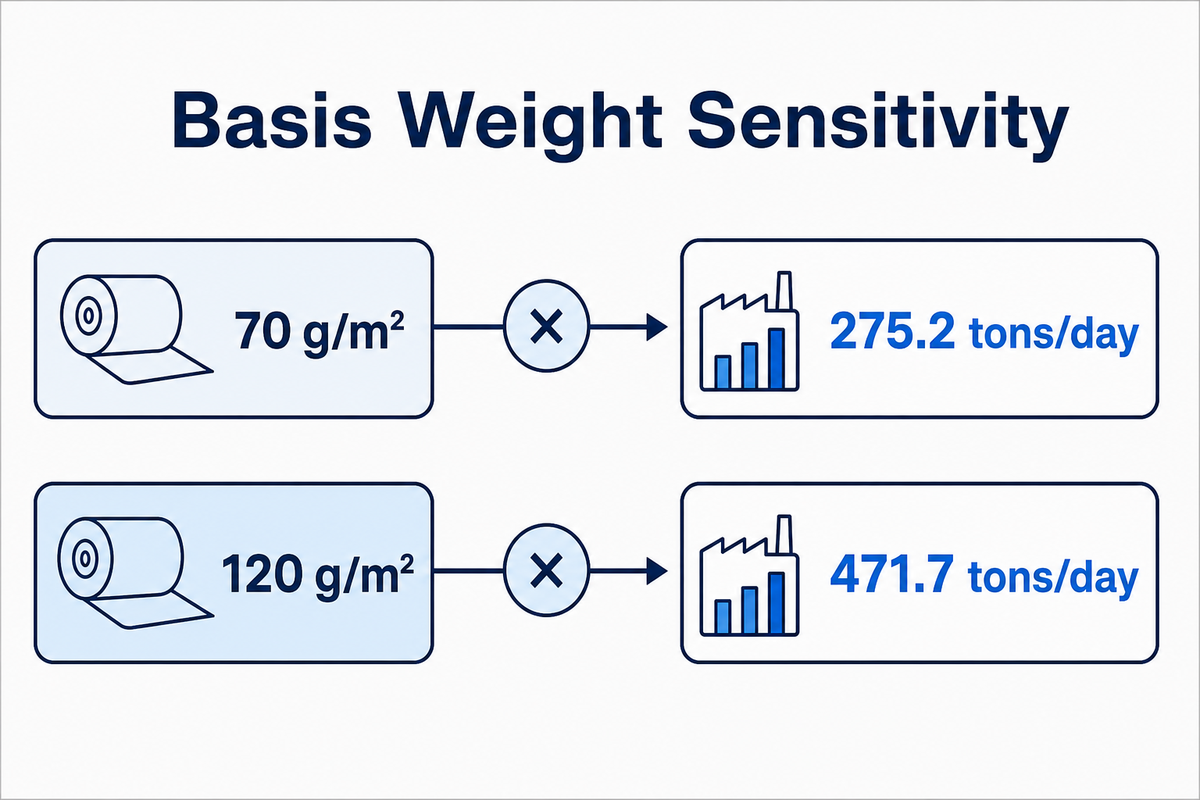
Basis weight (grammage) is defined by ISO 536 as mass per unit area of paper, in grams per square meter, and it enters the capacity formula as a direct multiplier, meaning a small change here moves your output number by exactly the same percentage. Grades commonly cited across the industry span roughly 40 g/m² for lightweight printing paper up to 250 g/m² or more for heavier packaging board, and the same machine running a heavier grade produces proportionally more tons per day at the same speed, even though it is making fewer meters of usable product per minute.
| Basis Weight | Gross Daily Rate (4.2m @ 650 m/min) |
|---|---|
| 70 g/m² | 275.2 tons/day |
| 120 g/m² | 471.7 tons/day |
This is also why a supplier’s quoted capacity is only meaningful next to a stated basis weight, a “500 tons/day” machine at 200 g/m² is a very different (and in speed terms, slower) machine than a “500 tons/day” machine at 80 g/m². Caliper (sheet thickness) and bond strength both shift with basis weight and furnish too, and for many applications those quality targets constrain the achievable speed before the raw capacity math does.
Machine Speed and Trim Width: The 9-Band Grade-Class Speed Guide
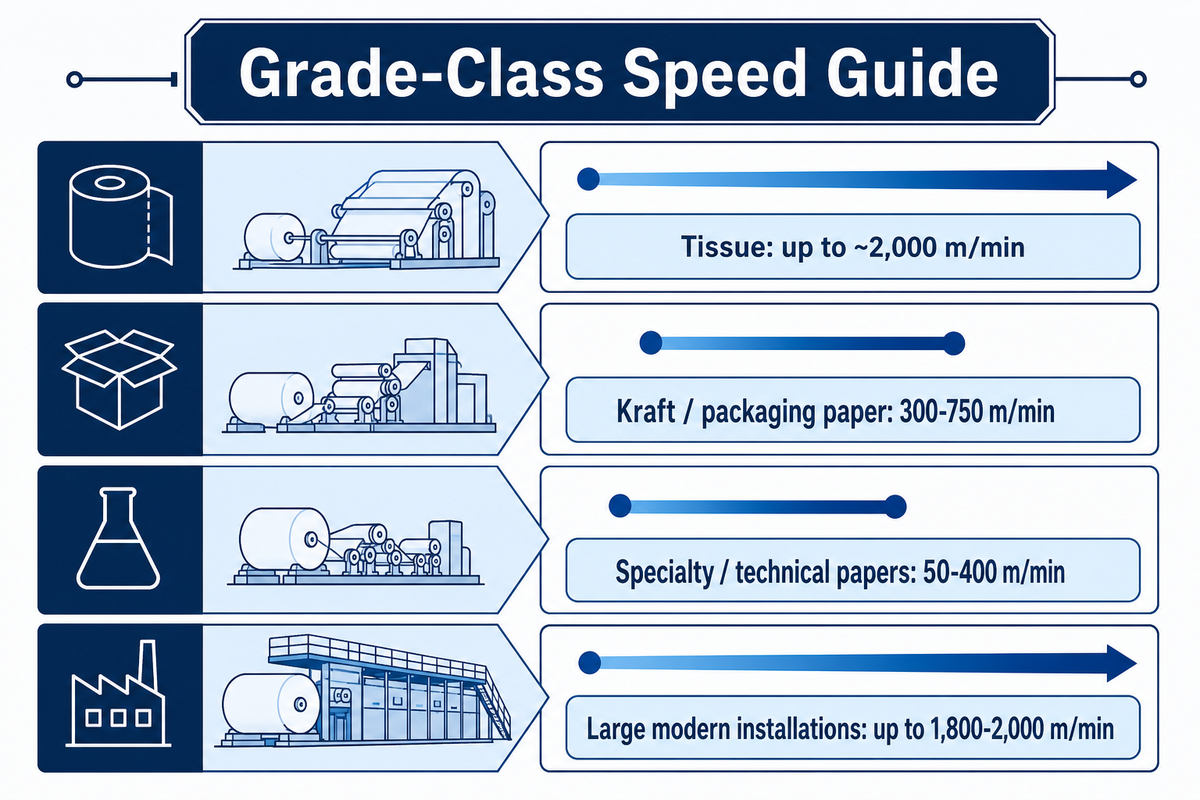
What counts as a realistic speed or trim width depends heavily on grade and machine class, and The 9-Band Grade-Class Speed Guide below brings together the ranges most commonly cited across patent filings, encyclopedic technical references, and academic overviews, presented as commonly-cited bands, not a precise statistical distribution, since patent claim language in particular tends to state broad permissible ranges for intellectual-property purposes rather than a survey of what mills actually run. Those same basis weight and quality constraints that shape achievable speed are exactly why the ranges below span such a wide band instead of converging on one number.
| Grade / Machine Class | Typical Speed | Typical Trim Width | Typical Basis Weight | Caveat |
|---|---|---|---|---|
| Tissue | Up to ~2,000 m/min | Varies by converting line | 12-40 g/m² | Fastest grade class; source cites this as an upper figure, not an average |
| Lightweight printing/writing | 600-1,200 m/min | 5-10 m | 40-90 g/m² | Wide range across older and modern installs |
| Newsprint | 500-900 m/min | Up to 10 m | 40-52 g/m² | Encyclopedic range spans several machine generations |
| Kraft / packaging paper | 300-750 m/min | 4-8 m | 80-200 g/m² | Patent-disclosed range is a permissible embodiment, not a survey average |
| Corrugated medium / linerboard | 400-900 m/min | 5-9 m | 100-250 g/m² | Overlaps kraft-grade band at the lighter end |
| Testliner / duplex board | 200-600 m/min | 3-7 m | 150-400 g/m² | Broadest range in this table; verify against your specific product mix |
| Specialty / technical papers | 50-400 m/min | 1.5-5 m | Varies widely | Lower end of the general wet-laid range; grade-dependent |
| Smaller / older installations | A few hundred m/min to 900 m/min | 1.5-8 m | Varies | Lower bound from an encyclopedic general reference, not a hard floor |
| Large modern installations | Up to 1,800-2,000 m/min | Up to 9-10 m | Varies | Upper bound seen in encyclopedic and academic sources; not universal |
If a supplier quotes a speed or width well outside The 9-Band Grade-Class Speed Guide for your grade, in either direction, that’s a reasonable prompt to ask what’s different about the machine, not an automatic red flag by itself.
The 10-Factor Nameplate-to-Actual Output Bridge: Efficiency, Yield, and Furnish Factors
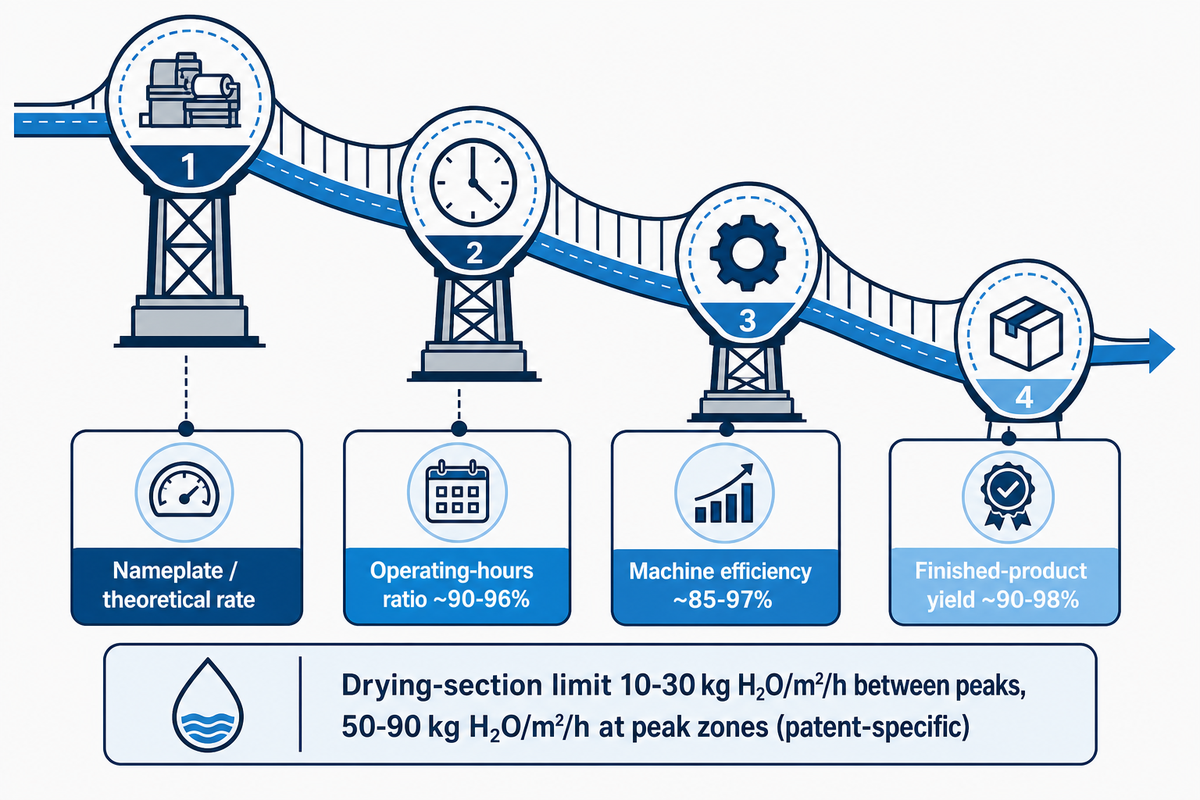
Every one of the discount factors between a gross theoretical rate and real shipped tonnage pulls in the same direction, down, which is why The 10-Factor Nameplate-to-Actual Output Bridge below walks through each one with a realistic range and its limitation, rather than presenting a single blended “efficiency number” that hides where the losses actually come from. With speed and trim width settled, this is the variable buyers most often underestimate: how much of that theoretical output actually survives real operating conditions.
| Factor | Typical Range | What It Represents | Limitations / Not Suitable For |
|---|---|---|---|
| Nameplate / theoretical rate | 100% (baseline) | Width × speed × basis weight, zero losses | Not a real output figure on its own — always needs further discounting |
| Operating-hours ratio | ~90-96% | Scheduled maintenance and planned changeovers | Varies heavily by maintenance philosophy — don’t assume an industry average applies to your line |
| Machine efficiency | ~85-97% | Unplanned stops, sheet breaks, quality holds | OEM demo-run figures should not be treated as a guaranteed achievable number |
| Finished-product yield | ~90-98% | Trim losses and off-spec rejects | Lower for tight-tolerance specialty grades than for standard commodity product |
| New-equipment ramp-up (Year 1) | ~70% of steady-state | Official phased ramp-up for newly commissioned lines | Applies to new equipment only, not an established or rebuilt line |
| New-equipment ramp-up (Year 2) | ~90% of steady-state | Second-year phased ramp-up | Still below full steady-state — don’t budget Year-2 revenue at 100% |
| Grade-mix weighting | Varies by product plan | Multi-grade lines apportion annual capacity by time-share per grade | Not applicable to a genuinely single-grade dedicated line |
| Furnish / pulp consistency | Machine- and stock-dependent | Affects defibering efficiency and downstream throughput | No single universal consistency ladder applies to every pulper or furnish |
| Drying-section limit | 10-30 kg H₂O/m²/h between peaks, 50-90 kg H₂O/m²/h at peak zones (patent-specific) | Caps achievable sheet speed at a given moisture and basis weight | Becomes the binding constraint mainly at higher basis weights; figure is design-specific, not universal |
| Downtime (grade changes, splices, acceleration cycles) | Highly plant-specific | Covered in detail in the next section | Must be measured on your own line, not assumed from a general figure |
Furnish behavior is one of the least visible factors on this list, but it’s real: pulp consistency changes defibering efficiency and downstream throughput, and academic testing confirms that consistency and rotor speed are the two primary variables driving how fast a given furnish actually processes, which is one more reason The 3-Input Rule is a starting sanity check, not a complete answer, once you’re comparing real quotes rather than back-of-envelope numbers.
Where Capacity Actually Gets Lost: Downtime, Grade Changes, and Drying Limits
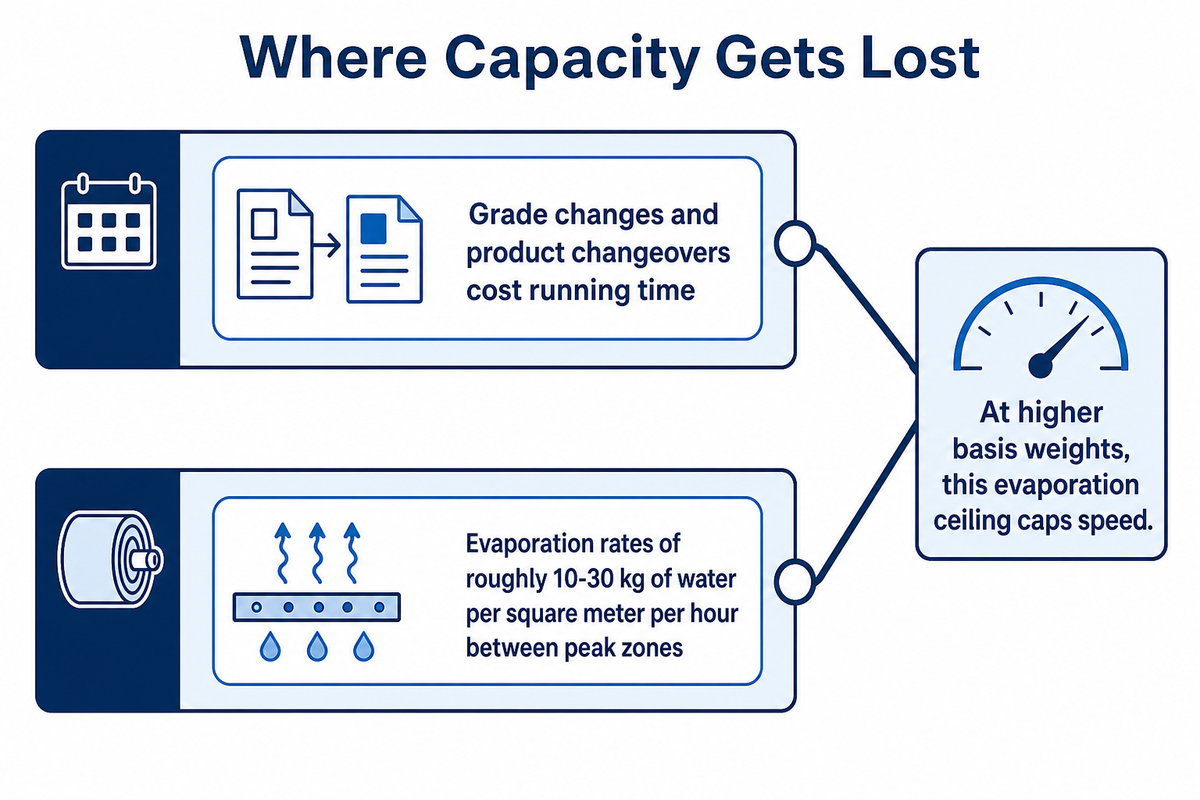
Beyond the formula and its discount factors, several physical and operational realities eat into capacity day to day: grade changes, speed-change acceleration cycles, and winder splices all cost running time, and knowing which of these are engineering-fixable versus schedule-fixable changes what you actually do about them.
Grade changes and product changeovers cost running time every time the line switches basis weight or furnish. Acceleration and deceleration cycles around speed changes, with rounding time between them typically measured in single-digit seconds, add up across a shift with frequent product changes. Splices, at the winder and elsewhere, are unavoidable but their frequency is a maintenance and material-quality question, not a fixed constant. The 10-Factor Nameplate-to-Actual Output Bridge groups these under “downtime,” but the honest answer is that this number is the most plant-specific line in the whole table — it has to be measured on your own equipment, not borrowed from an industry rule of thumb. Good gear-box and drive maintenance, and a clean, well-controlled wet end, both help prevent the unplanned stops that erode this figure over a production year.
Drying deserves its own mention because it’s a hard physical limit rather than an operational choice: a patented multi-stage drying method for this exact configuration class specifies evaporation rates of roughly 10-30 kg of water per square meter per hour between peak zones, rising to 50-90 kg/m²/h at the peak-evaporation zones themselves, a figure that varies by dryer design and shouldn’t be assumed universal across every machine, with the paper web entering the drying section at roughly 35-55% dry content depending on the forming and pressing configuration upstream. Each steam-heated dryer roll runs at a set surface temperature, and the headbox slice opening upstream, which meters how the stock lands on the wire, also shapes how much water the dryer section has to remove per unit of web width, which is one more reason a single generic drying formula can’t substitute for your own machine’s real performance data. At higher basis weights, this evaporation ceiling, not the wire section’s mechanical speed limit, is often what actually caps how fast the machine can run. Some mill engineers reportedly use simplified drying-capacity approximations built around effective drying length, cylinder surface, and sheet speed for a quick check, though the exact coefficients are configuration-specific and should be confirmed against your own machine’s documented performance rather than treated as a universal constant.
Capacity-planning discipline like this isn’t unique to papermaking. Buyers of almost any large capital equipment face the same nameplate-versus-actual gap, from packaging lines to specialized pressure equipment such as hyperbaric chambers, where rated capacity and real duty-cycle throughput are two different numbers for the same underlying reasons.
Common Capacity-Calculation Mistakes (When NOT to Trust a Nameplate Number)
The most common mistake is treating a supplier’s headline output figure as a guarantee rather than a starting point, selecting or quoting equipment on the highest nameplate number alone, without asking which discount factors were assumed. Close behind that: ignoring how a grade-mix or basis-weight change shifts the real number (see the basis-weight section above), assuming a fixed efficiency percentage applies regardless of product, and skipping furnish-consistency variability entirely. Buyers who plan around 100% of a quoted daily rate, instead of running The 10-Factor Nameplate-to-Actual Output Bridge themselves, are the ones most often disappointed by first-year production numbers, especially since new equipment is officially expected to ramp at only 70% of steady-state in its first 12 months.
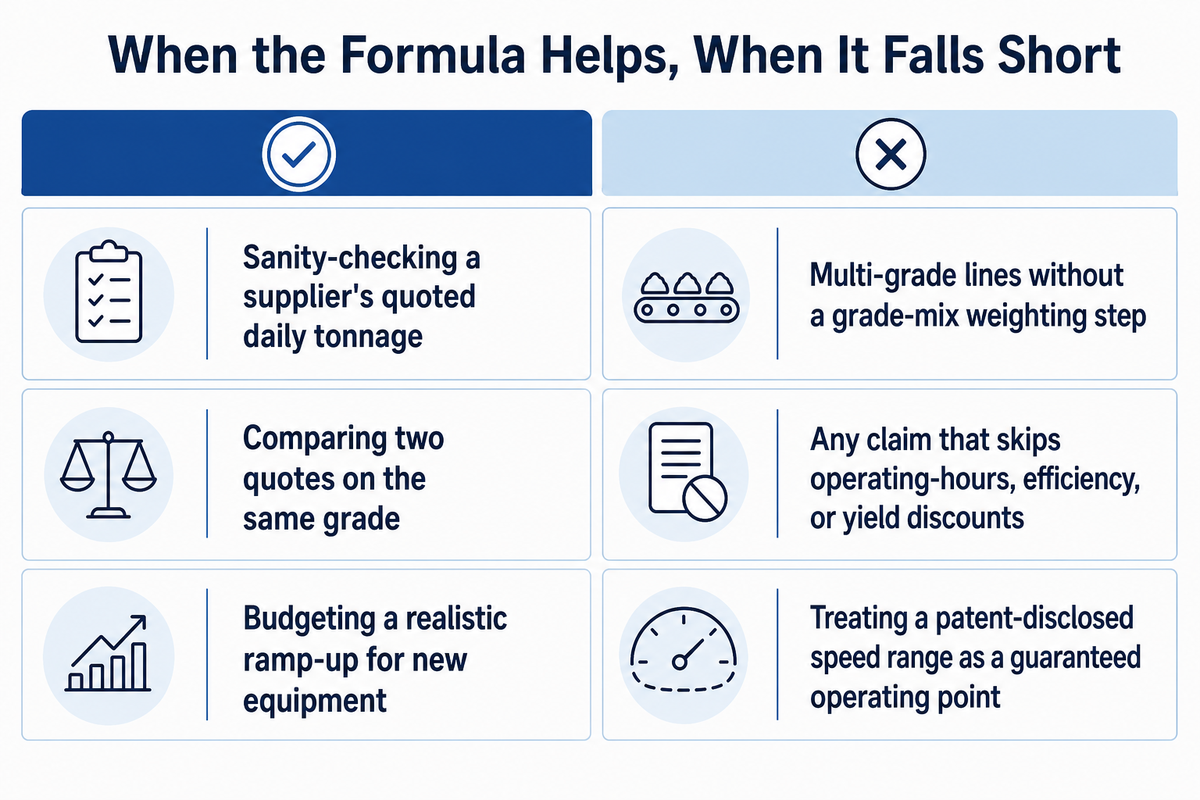
✔ When the Formula Approach Works Well
- Sanity-checking a supplier’s quoted daily tonnage against The 3-Input Rule
- Comparing two quotes on the same grade and rough machine class
- Budgeting a realistic ramp-up for new equipment
⚠ When It Falls Short
- Multi-grade lines without a grade-mix weighting step
- Any claim that skips the operating-hours, efficiency, or yield discounts
- Treating a patent-disclosed speed range as a guaranteed operating point
Why Paper Mill Capacity Math Matters More Right Now
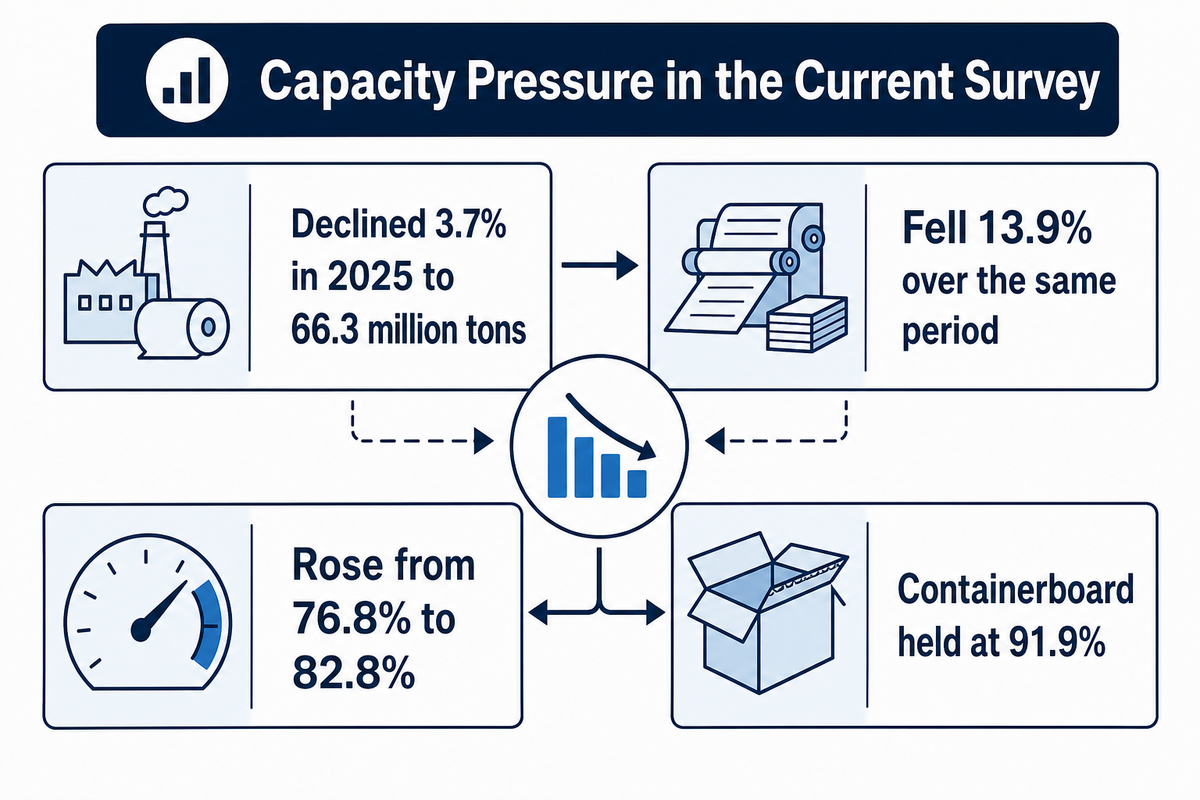
US paper and paperboard production declined 3.7% in 2025 to 66.3 million tons, and printing-writing capacity specifically fell 13.9% over the same period, yet the printing-writing operating rate rose from 76.8% to 82.8%, and containerboard held at 91.9%, according to the American Forest and Paper Association’s 66th Annual Survey. Put together, that’s a shrinking installed base running harder, not a market in simple decline.
Against that backdrop, a mistake like treating a quoted speed range as a guaranteed operating point costs more than it used to. When mills are working with less total capacity rather than building new lines, the cost of a wrong capacity estimate, an RFQ sized to the wrong throughput, a retrofit justified on an optimistic payback, rises, because there’s less slack capacity elsewhere to absorb the mistake. Getting the underlying math right matters more precisely because capacity itself has become the constrained resource.
From Calculation to Procurement: Turning Your Annual Production Number Into an RFQ
Once you have a realistic annual figure from The 10-Factor Nameplate-to-Actual Output Bridge, not the raw 3-Input Rule number, the next step in capacity management is turning it into a request for quotation a supplier can actually price against; getting this handoff right, including a properly cooled and stabilized reel before shipment specs are finalized, avoids re-negotiating scope after the order is placed. Built directly from the variables this primer has walked through, the checklist below is ready to copy into a real RFQ.
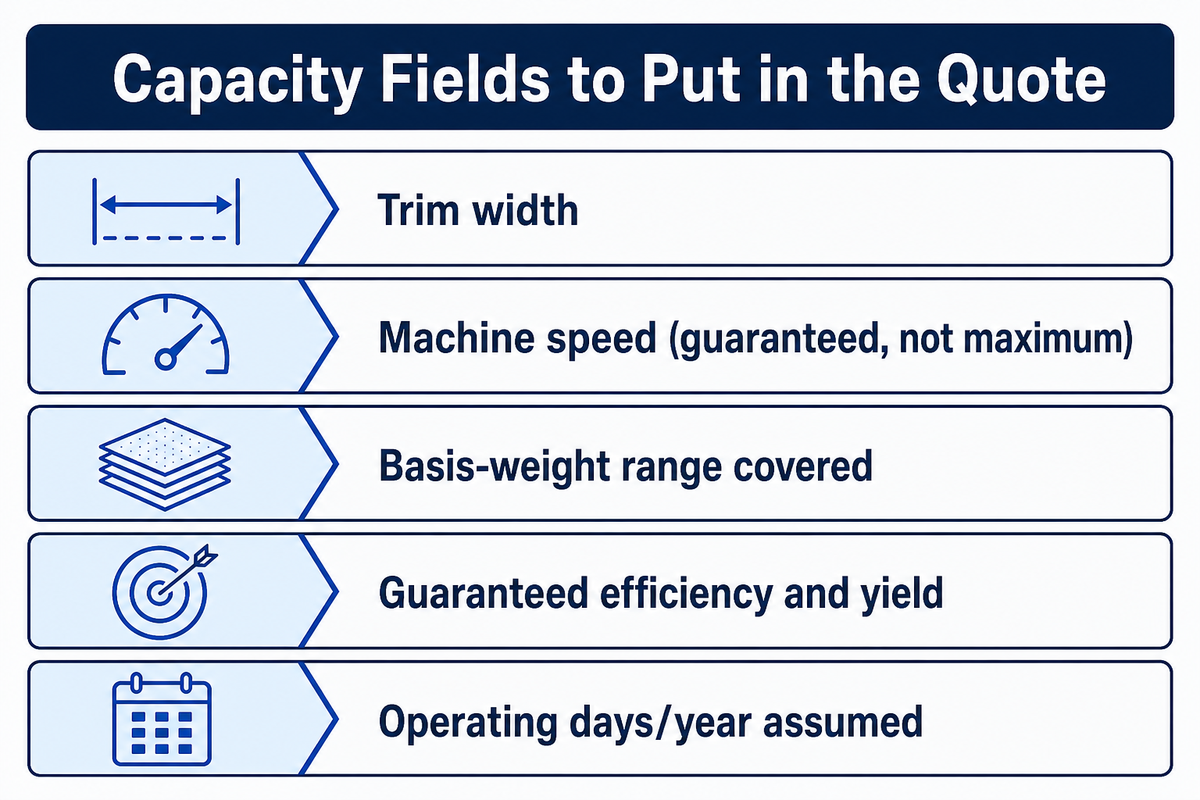
RFQ checklist — copy these into your quote request:
| Parameter | Recommended range | Why it matters | How to verify |
|---|---|---|---|
| Trim width | Match your product’s saleable width plan | Directly multiplies every output figure | Confirm against The 9-Band Grade-Class Speed Guide for your grade |
| Machine speed (guaranteed, not maximum) | See grade band above | Suppliers may quote a peak speed, not a sustained one | Request the guaranteed sustained speed in writing, not the demo-run peak |
| Basis-weight range covered | Your full product mix, not just the headline grade | Capacity swings directly with basis weight | Ask for capacity at each grade you plan to run, not one blended figure |
| Guaranteed efficiency and yield | 85-97% efficiency / 90-98% yield (grade-dependent) | This is where nameplate diverges from real output | Request contractual performance-test guarantees, not marketing ranges |
| Operating days/year assumed | State your real maintenance calendar, not 365 | Annual tonnage claims hinge on this assumption | Cross-check the supplier’s assumed operating days against your own schedule |
From here, the client’s own capacity-to-grade selector tool is a reasonable next step for turning this checklist into a shortlist of machine configurations, and a project’s broader cost drivers for a new paper mill are worth reviewing alongside it, since capacity is only one of several factors that determine total project cost. For the supplier-vetting side of this process, separate from the math itself, our supplier vetting and RFQ comparison guide covers how to compare quotes on equal terms once the numbers above are on the table.
Frequently Asked Questions
Q: How do you calculate mill capacity?
Multiply the machine’s trim width, running speed, and basis weight to get a gross theoretical rate, then discount that number with real operating-hours, machine-efficiency, and finished-product-yield factors to reach realistic net output.
Mill capacity is calculated by multiplying the machine’s trim width, running speed, and the basis weight of the paper being produced, then converting the result into a mass-per-time figure and adjusting it down with real operating-hours, machine-efficiency, and finished-product-yield factors. A spec-sheet nameplate number is only the starting point; actual mill capacity always ends up lower once downtime, grade changes, and furnish variability are accounted for.
Q: What is the formula to calculate paper machine production capacity?
Daily capacity (tons) = trim width (m) × speed (m/min) × basis weight (g/m²) × 1,440, divided by 1,000,000 to convert grams to tons, then multiplied by the operating-hours, machine-efficiency, and finished-product-yield discount factors.
In short, daily capacity (tons) = trim width (meters) × machine speed (meters per minute) × basis weight (grams per square meter) × operating minutes per day, divided by 1,000,000 to convert grams to tons, then multiplied by an operating-hours ratio, a machine-efficiency factor, and a finished-product-yield factor. Each of the three efficiency-style multipliers is typically well under 1.0, which is why a machine’s real annual output is always meaningfully lower than the raw width-speed-weight math suggests.
Q: What is the drying capacity formula for a paper machine?
There is no single universal formula, drying capacity is bounded by evaporation rate, roughly 10-30 kg H₂O/m²/h between peaks and up to 50-90 kg H₂O/m²/h at peak zones in one patented design.
Drying capacity is usually expressed as a limit on how much water the dryer section can remove per unit of time at a given sheet speed and moisture target, rather than as a single universal formula, patent literature for one specific multi-cylinder design places evaporation capacity at roughly 10-30 kg H₂O/m²/h between peak-evaporation zones, rising to 50-90 kg H₂O/m²/h at the peaks themselves, though this varies by dryer configuration. Some mill engineers reportedly use simplified drying-capacity approximations built around effective drying length, steam-heated cylinder surface, and sheet speed, but the exact coefficients vary by dryer configuration and are normally confirmed against the specific machine’s own performance data rather than a generic textbook constant.
Q: What’s the difference between nameplate capacity and actual output?
Nameplate is the theoretical ceiling a machine’s width, speed, and basis weight produce with zero losses; actual output is the tonnage that really ships once downtime, grade changes, and yield losses are subtracted.
Nameplate is a theoretical ceiling. Actual output ships after losses.
Q: How many tons per day can a small paper machine produce?
Smaller or specialty-grade paper machines commonly produce anywhere from a few dozen up to a few hundred tons per day, depending on trim width, speed, and basis weight, well below large wet-laid installation figures.
Smaller or specialty-grade paper machines commonly produce in the range of a few dozen up to a few hundred tons per day, depending on trim width, speed, and basis weight, well below the 400-800+ tons/day figures cited for large wet-laid installations, or the 300+ tons/day upper figure cited for the smaller end of general industrial machines. This same formula applies at any scale: run your own trim width, speed, and basis weight through The 3-Input Rule to get a realistic starting figure, then apply the discount factors from The 10-Factor Nameplate-to-Actual Output Bridge for your specific operation.
Related Articles
References & Sources
- FAO World Surveys of Pulp and Paper Capacity and Production — capacity definitions — Food and Agriculture Organization of the United Nations
- US Patent 11299854B2 — Paper product articles — Eastman Chemical Company / USPTO
- EP1012386B1 — Method for optimizing evaporation drying of paper — European Patent Office / Google Patents
- Grammage (ISO 536 basis-weight definition) — Wikipedia
- Paper machine — sections and speed reference — Wikipedia, citing TAPPI Press
- Nameplate capacity — Wikipedia
- AF&PA 66th Annual Paper Industry Capacity and Fiber Consumption Survey — American Forest & Paper Association, 2026-05-29
- United States paper, paperboard, and market pulp capacity trends by process and location, 1970-2000 — USDA Forest Service Research and Development
The Team Behind This Report
We build and rebuild paper machines and stock-preparation lines for mills across Asia, the Middle East, Africa, and South America, which means we field capacity questions from buyers comparing a spec sheet against their own production targets more often than almost any other topic. This primer pulls together the engineering-standard definitions, patent-disclosed operating ranges, and current industry survey data behind that one recurring question, because a nameplate number is only useful once you know exactly what it does and doesn’t already account for.
Reviewed by the Henan Zejiang Paper Machinery technical team.



![Refiner Plates & Screen Baskets [Complete Guide]](https://zjpapermachine.com/wp-content/uploads/2026/07/refiner-plates-screen-baskets-guide-featured-150x150.png)
![Doctor Blade: Types, Materials & How It Works [Guide]](https://zjpapermachine.com/wp-content/uploads/2026/07/doctor-blade-guide-featured-1-150x150.png)
![Pulping Equipment: How Paper Pulping Works [Guide]](https://zjpapermachine.com/wp-content/uploads/2026/07/pulping-equipment-guide-featured-150x150.png)