
Get in touch with Zejiang Paper Machinery Company



Updated October 2026
A TMP refiner is the main mechanical treatment unit in a thermomechanical pulping line. Prepared wood chips are heated with steam so the lignin-rich structure softens. Patterned refining discs then separate fiber bundles and develop the fibers under pressure. The goal is a usable balance of fiber separation, strength potential, drainage, bulk, opacity, shives and energy.
That balance can’t be read from motor load alone. Chip species and size, moisture, steam conditions, dry production rate, dilution, plate pattern, stage duty and sampling delay all affect the result. Some mills also add reject refining or low-consistency post-refining after the chip-fed stages, so the words “TMP line” don’t prove that every refiner in it receives chips.
This guide gives process engineers, maintenance teams and technical buyers four tools: the Steam-to-Fiber TMP Map, the TMP Stage-Purpose Register, the TMP Energy-Boundary Worksheet and the Seven-Signal TMP Control Board. These tools help a team define the system they’ve, compare like with like, and marshal evidence before a hardware discussion.
Key takeaway
Judge a TMP refiner as part of a coupled chip, steam, refining, screening and heat system. Normalize energy to the right boundary, align process changes with the correct pulp sample, and read shives, freeness, fiber morphology and sheet properties together.
Quick Answer: What Is a TMP Refiner?
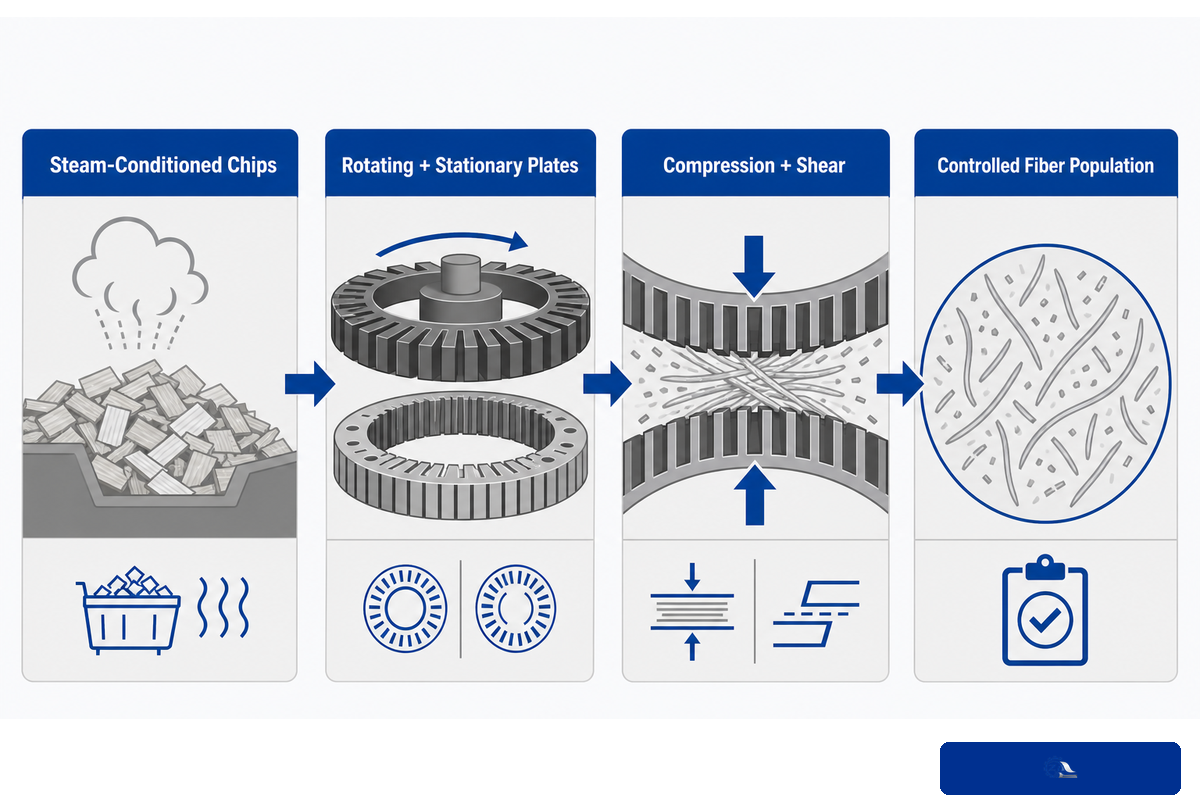
TMP stands for thermomechanical pulping. The refiner receives steam-conditioned wood chips or, in a later-stage application, partially refined pulp. Rotating and stationary plate segments form a treatment zone. Bars, grooves and dams move material radially, while repeated compression and shear, as well as fiber-to-fiber contact, further break down bundles and alter the surface of the fibers.
Heating plays an important role because the softening of lignin alters the way that wood fibers separate. The mechanical action still requires a great deal of electrical energy, and a major part of that input becomes heat and steam. Lower shive levels may be useful, but not if they come with unacceptable fiber shortening, fines, strength loss or energy use. The useful outcome is a controlled fiber population, not a single gap or power number.
A TMP refiner is dissimilar from a normal low-consistency stock refiner used after chemical pulping or recycling. The feed state, temperature, pressure and process objective differ. However, a TMP line can contain a low-consistency refiner after screening or fractionation. Know the specific machine’s duty rather than generalize to the entire line.
Literature from years past might have grouped these routes under the family name of refiner mechanical pulping. Useful for historical classification, that label still doesn’t make atmospheric-pressure RMP, pressurized TMP and chemically pretreated CTMP operating conditions interchangeable.
TMP vs RMP, CTMP and Stock Refining
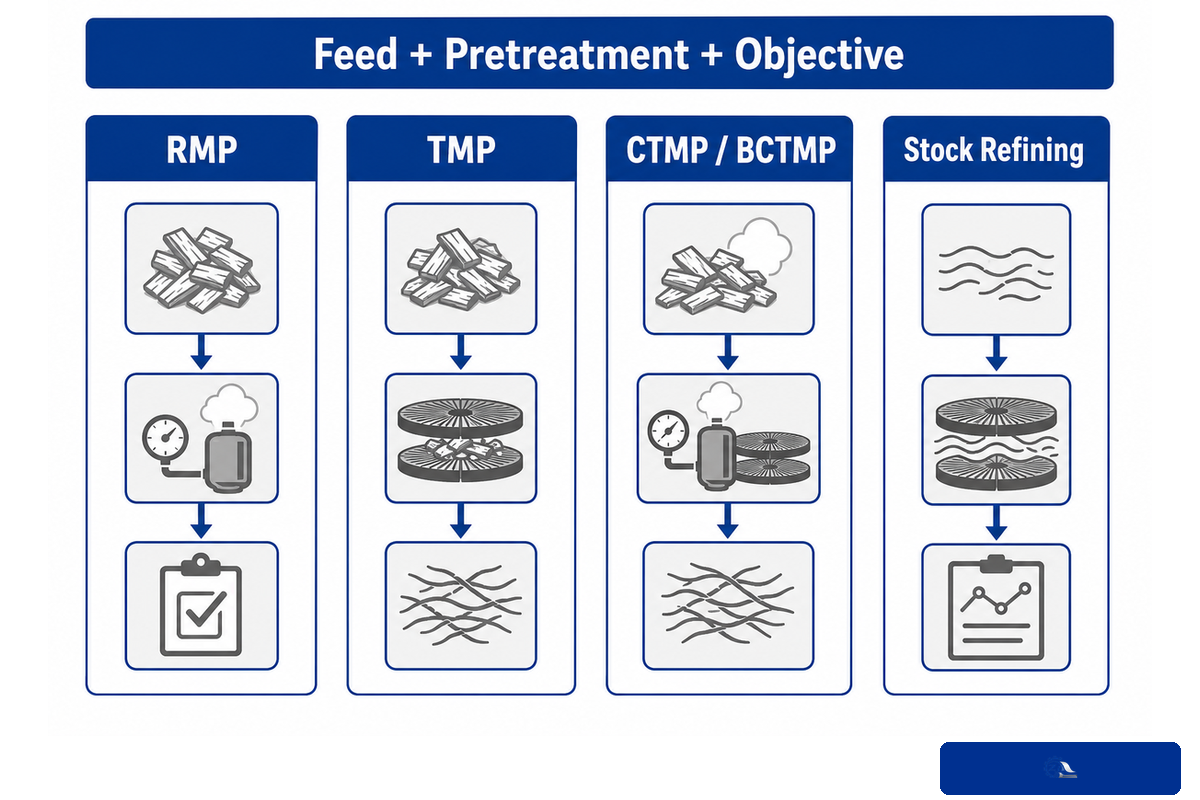
To separate these processes, ask three questions: What enters the refiner? What pretreatment occurs? What’s the required fiber outcome? The acronym doesn’t tell you the plate duty by itself; the broader pulp refining process still depends on feed, consistency and stage position.
Different types of mechanical pulping processes occur in pulp production. Older mill literature also writes the TMP process as thermo-mechanical pulping. That spelling difference doesn’t change the need to define feed, pressure and stage duty.
| Process | Typical feed | Pretreatment | Main objective | Important limit |
|---|---|---|---|---|
| RMP | Prepared wood chips | Limited thermal treatment | Mechanical fiber separation | Layout and pressure vary |
| TMP | Prepared, steam-conditioned chips | Thermal softening under pressure | Defibration plus fiber development | May include pulp-fed later stages |
| CTMP/BCTMP | Prepared chips | Chemical impregnation plus heat | Modify separation and final properties | Chemistry and bleaching change the boundary |
| Stock refining | Already pulped fibers in water | Screening, blending and dilution | Develop bonding and drainage response | Settings are not transferable from chip refining |
When reviewing equipment or trial data, record feed state at each step. Both a primary TMP refiner handling steam-softened chips and a post-screen low-consistency refiner handling pulp can belong to the same production line, but their plate geometry, consistency regime and quality role aren’t the same.
The Steam-to-Fiber TMP Map
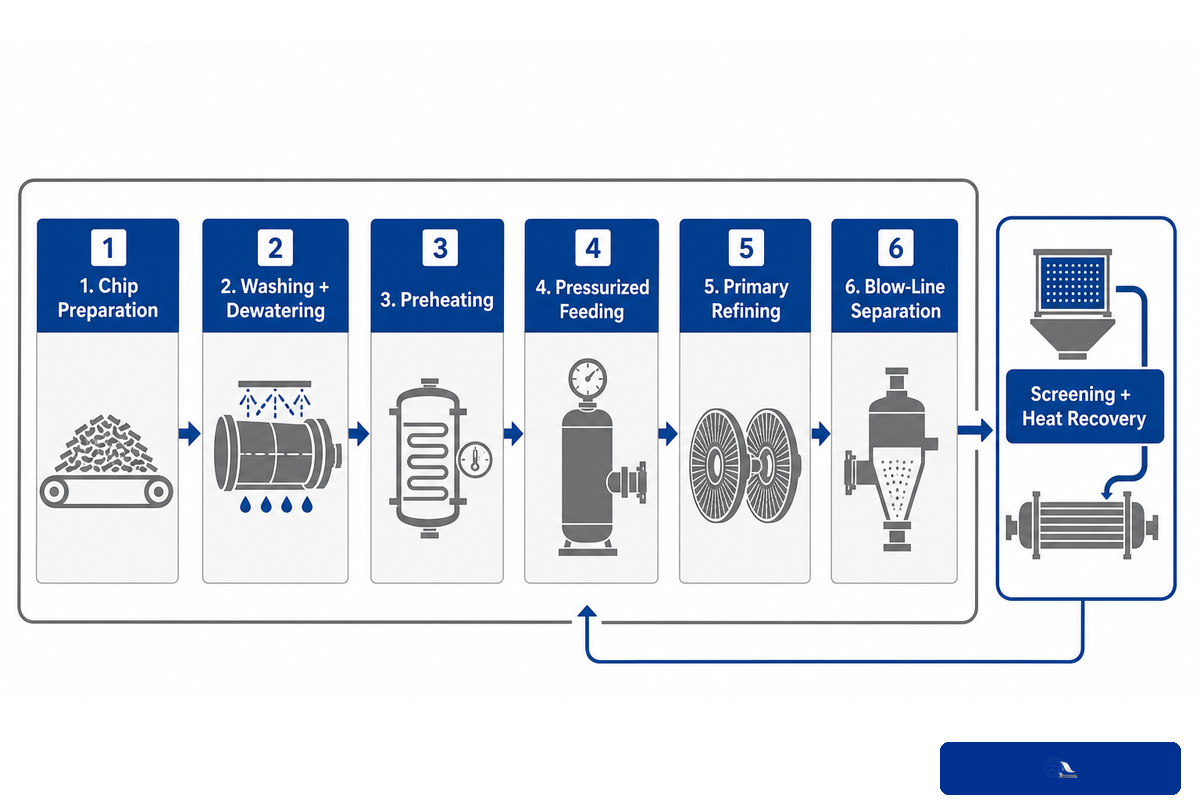
The Steam-to-Fiber TMP Map shows a representative flow to help decide where the process boundary lies to determine which measurement belongs to refiner and where it belongs to chip preparation, screening and heat recovery.
| Stage type | Process duty | Evidence to retain | Common comparison error |
|---|---|---|---|
| 1. Chip preparation | Remove debris and control size distribution for a cleaner feed | Species, moisture, size and rejects | Treating all chip batches as equal |
| 2. Washing and dewatering | Reduce contaminants and stabilize feed | Water flow, debris and moisture | Blaming plates for upstream grit or stones |
| 3. Preheating | Condition chips with steam | Pressure, temperature and residence time | Comparing energy without thermal condition |
| 4. Pressurized feeding | Meter chips into the refining system | Feed rate, plug stability and pressure | Using volumetric flow as dry production |
| 5. Primary refining | Separate softened chip structure | Gross/net power, dry rate, dilution and steam | Reading load without feed quality |
| 6. Blow-line separation | Separate steam and move pulp | Pressure, temperature and steam destination | Counting all generated steam as recovered value |
| 7. Interstage handling | Condition, buffer or equalize pulp | Residence time, consistency and latency treatment | Ignoring delay between stages |
| 8. Later or reject refining | Continue bundle separation or targeted development | Stage load, feed quality and accepted fraction | Assuming every stage has the same job |
| 9. Screening and acceptance | Separate accepts, shives and rejects | Shives, reject rate, recirculation and final properties | Judging a refiner without screening balance |
Current OEM process descriptions also cover aspects such as steam recovery, fractionation, long fiber treatment, bleaching and dewatering. Those unit operations are in the system map since they impact what a mill recognizes as useful energy and saleable pulp, even if they aren’t within the refiner housing.
What Happens in Primary and Secondary Refining?
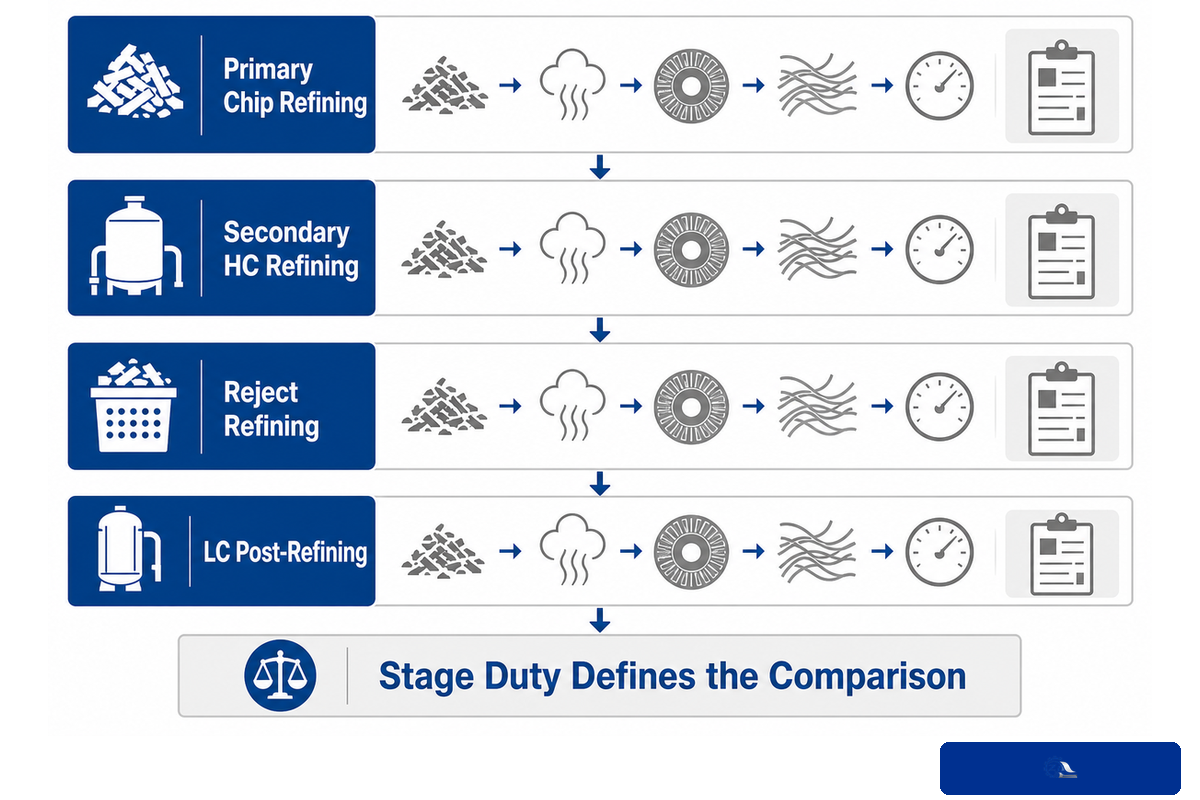
Older mill literature also writes the TMP process as thermo-mechanical pulping. Steam-softened chips move through breaker, intermediate and finer treatment regions and leave as a hot mixture of fibers, bundles and fines, along with the steam. Later stages further bundle separation and fiber development under different feed conditions.
Stage names are only truly meaningful when coupled with duty. Some lines contain one, two or three high consistency refiners. Other systems add a low consistency refiner after screening or direct a reject fraction to separate refining. Energy can be moved between stages resulting in a change in quality, even when total energy appears to be the same.
Rotor arrangement is also important. For example, a single-disc and a double-disc refiner can distribute flow and mechanical loading differently, so we should include model names in any stage comparison we make.
| Stage type | Feed state | Dominant job | Useful signals | Do not assume |
|---|---|---|---|---|
| Primary chip refining | Steam-conditioned chips | Initial defibration | Feed, steam, power, gap, pressure and shives | Power equals useful fiber development |
| Secondary HC refining | Hot coarse pulp and bundles | Further separation and development | Stage energy, consistency, freeness, shives and fiber length | Its plate can copy the primary stage |
| Reject refining | Screened coarse fraction | Target the rejected material | Reject rate, recycle load and accepts quality | More reject energy always improves total yield |
| LC post-refining | Pulp suspension | Selective strength or fiber development | Consistency, dry flow, net energy, fiber length and sheet tests | Published savings transfer to another mill |
Benefits are reported in published TMP system work reports from replacing or supplementing a high consistency stage with a low consistency refining step in defined cases. There are also reported property trade-offs. Treat numbers as evidence that architecture matters, and not as a definitive retrofit case.
How Plate Pattern Changes the Treatment
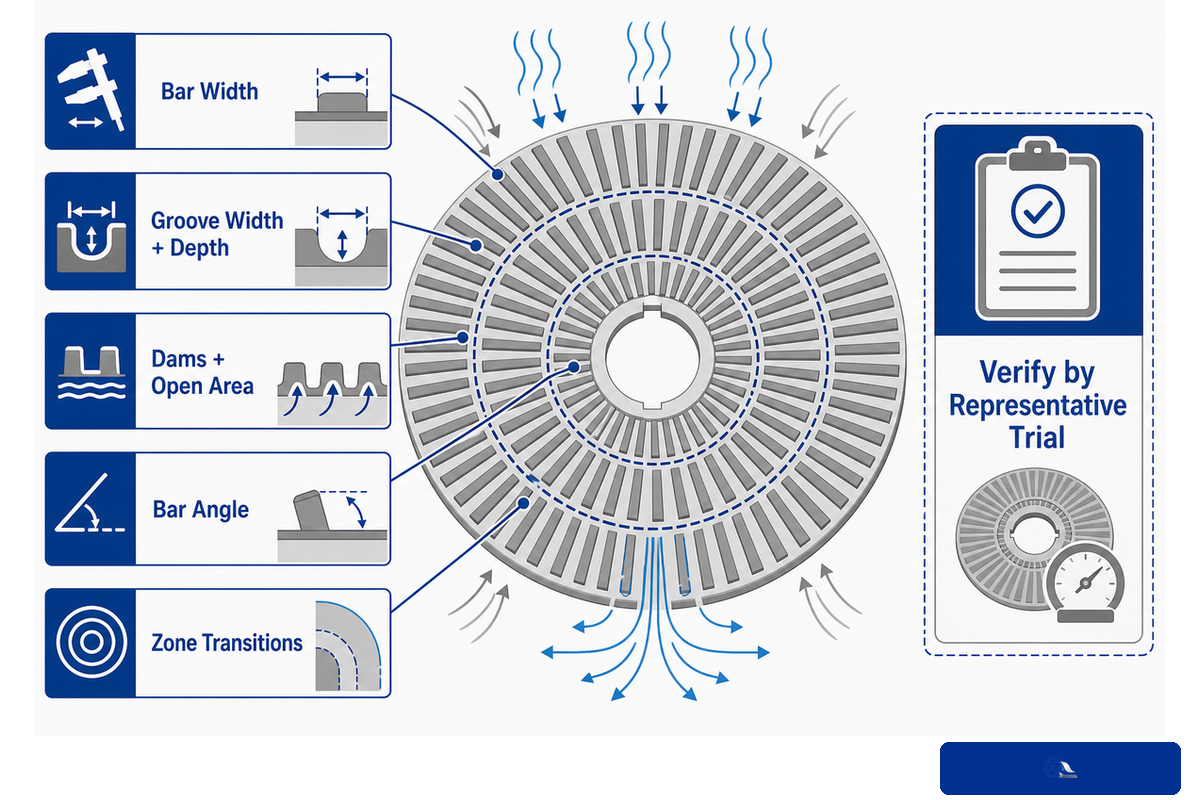
Each refiner plate is both a flow device and a treatment surface. Bar width, groove width and depth, dams, open area, bar angle, active-edge length and transitions between zones affect residence, steam movement, fiber capture and loading. Two patterns can receive similar specific energy while creating different fiber responses.
In a controlled plate-pattern study, the tested designs changed throughput and fiber morphology. The authors related certain refining energy to total load, no-load power, flow and consistency, and then analyzed fiber length, width, fines, and related properties. The result provided a rationale to conclude that plate patterns do impact refining. It didn’t prove that one particular named pattern is always the best for any given wood species, stage or production rate.
The same laboratory study prepared chips measuring about 4–6 mm by 2–3 mm, soaked them near 40 °C to reach roughly 50–55% moisture, and used a defined 100 °C steaming step for about 10 min. It later measured freeness under ISO 5267-2 and shives with a 0.15 mm Somerville-screen method. These values document that experiment; they are not industrial operating targets.
The patent literature provides another useful boundary. Public disclosures show that features such as curved, jagged and zoned bars are engineered variables. Patent claims describe intended effects, not independent mill validation. Use them to define design space, and then expect verification by way of representative trial data.
Plate wear changes this geometry over time. Rounded edges, eroded bars, deposits, damaged dams, contact marks and uneven zones can alter load distribution and flow. Purchase discussions should begin with stage duty, plate condition and operating trends because diameter alone won’t tell the whole story.
Where the Energy Goes and Why Steam Recovery Matters
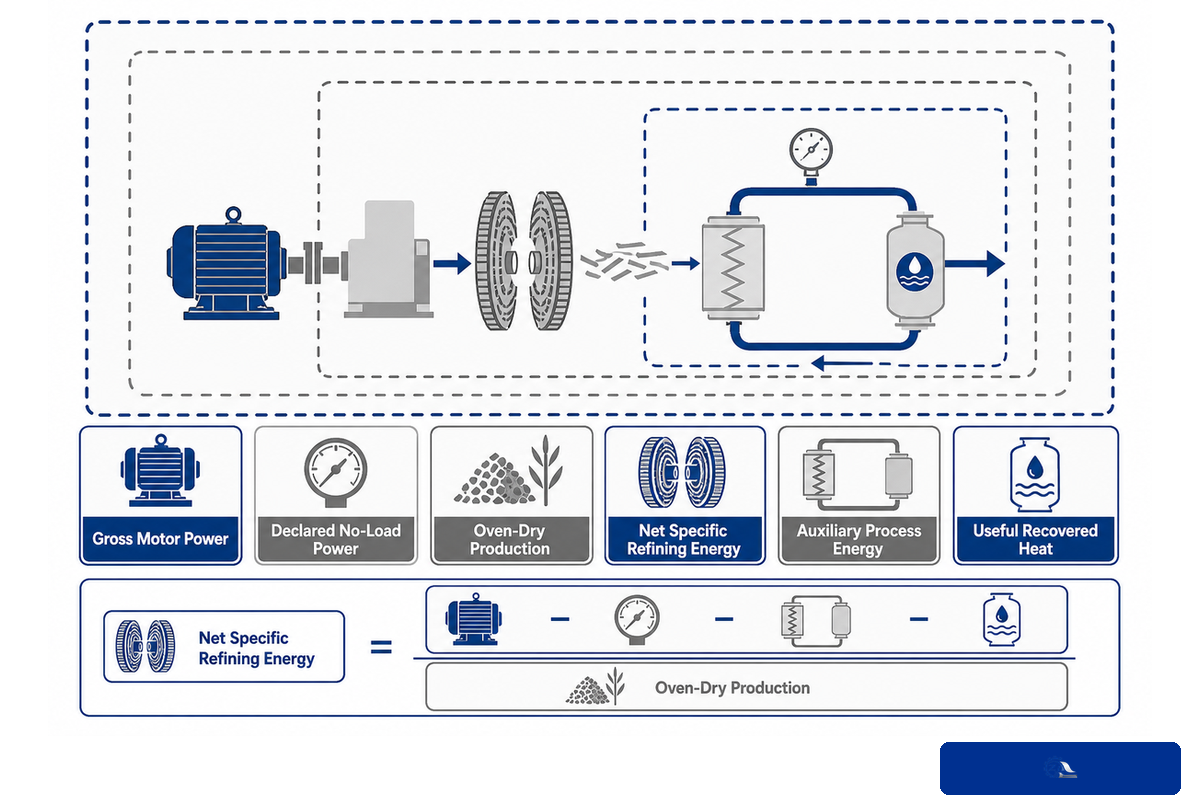
Before “energy per ton” can be interpreted, the boundary must be defined. The same project may involve all four measures, each answering a different question, so keep gross motor load, the declared no-load basis, oven-dry production and useful recovered heat separate instead of treating a lower kWh/t as proof of better fiber treatment or lower mill energy.
- Gross motor energy shows electrical loading at the drive.
- Net specific refining energy subtracts a declared no-load basis from gross motor power and divides by oven-dry production.
- “process energy” includes the relevant auxiliary energy, such as feeding, pumping or screening.
- “Recovered thermal value” is attributed only to heat which is captured and used within a defined boundary.
Net specific refining energy can be written as:
“Net SRE (kWh/ oven-dry t production) = (gross motor kW – declared no-load kW) / (oven-dry production t/h)”
No-load power isn’t always a fixed nameplate number. Speed, flow, plate set and equipment condition can all affect losses. Keep the basis constant across comparable scenarios, and never present a calculated treatment metric as the whole mill’s electrical efficiency.
Projects may target energy savings, cost control or a reduction in purchased electricity, but the calculation still needs a quality constraint. An increase in throughput can lower kWh/t while total kW increases; this doesn’t prove improved fiber treatment. Report both the production and property consequence.
| Field | Unit/basis | Why retain it | Frequent error |
|---|---|---|---|
| Gross motor load | kW at timestamp | Drive and equipment loading | Calling it fiber-treatment energy |
| No-load basis | kW with test condition | Separates declared losses | Using an old value without conditions |
| Oven-dry flow | t/h and method | Normalizes treatment dose | Using wet or volumetric flow |
| Auxiliary loads | kW by equipment | Defines process comparison | Moving load outside the boundary |
| Generated steam | flow, pressure, temperature | Shows recoverable supply | Equating generation with useful recovery |
| Useful heat destination | consumer and time match | Closes the recovery boundary | Crediting steam with no simultaneous demand |
The 7-Signal TMP Control Board
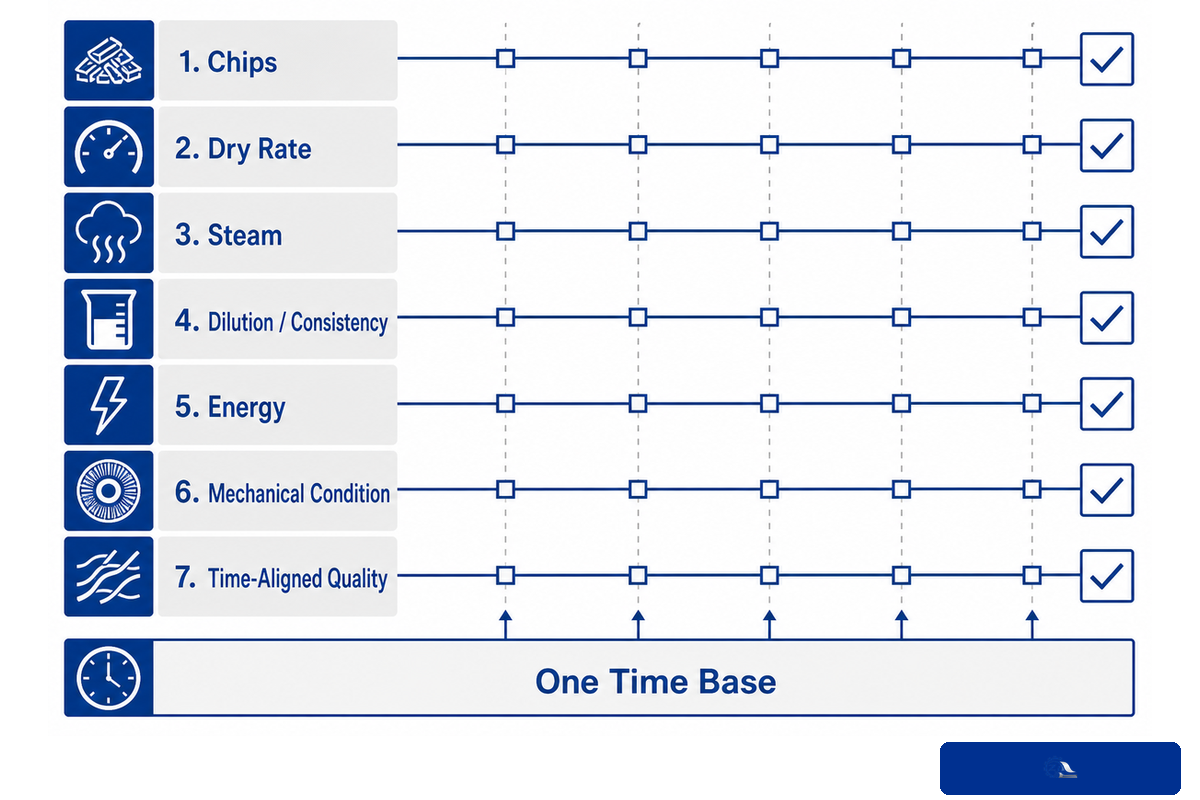
The 7-Signal TMP Control Board prevents a team from treating one tag as the process. Put all seven signal families on the same time base, and determine which confounder could produce the same effect.
| Signal family | What it can explain | Main confounder | Confirmation check |
|---|---|---|---|
| 1. Chips | Fiber potential and feed stability | Species, moisture or size shift | Retained chip sample and screen data |
| 2. Dry rate | Energy dose denominator | Consistency or flow error | Independent dry-solids balance |
| 3. Steam | Thermal condition and separation behavior | Sensor location or residence time | Pressure-temperature-residence review |
| 4. Dilution/consistency | Flow, crowding and intensity | Sample location | Timed laboratory consistency |
| 5. Energy | Load and normalized dose | Wrong no-load or system boundary | Recalculate gross, net and process values |
| 6. Mechanical condition | Gap, wear and instability | Process pulsation or bad sensor | Vibration, pressure, gap and inspection evidence |
| 7. Time-aligned quality | Actual pulp and sheet response | Transport, chest and lab delay | Sample lineage and response window |
| Decision rule | Use all seven signals to establish the baseline before comparing refiner sizing inputs, stage duty or replacement geometry. | ||
One published CTMP time-series study reported a lag between a refiner change and measured pulp response in its own plant. The actual value isn’t portable. The main point of this case study is to identify your own line’s volume, mixing behavior, sample location, and laboratory’s delay before comparing a process to a test.
When gross power increases but quality remains the same, determine dry flow and check the no-load basis before changing the gap again. A decrease in freeness along with decrease in fiber length and tear may indicate the process is beyond the grade window. If vibration changes without a process change, validate the sensor and check pressure or flow oscillation before assigning the cause to plates.
In industrial mechanical pulping, this control method relates plant data to process. It handles energy consumption, mechanical energy and specific energy as connected but distinct concepts. It also maintains energy conservation arguments within stated boundaries. Better TMP technology could be used to promote energy efficiency, but only if the mill indicates which auxiliaries and recovered heat are included. Andritz AG, for example, describes heat recovery architecture; that’s system context, not a universal saving.
Fiber Quality Trade-Offs: Shives, Fines, Freeness and Strength
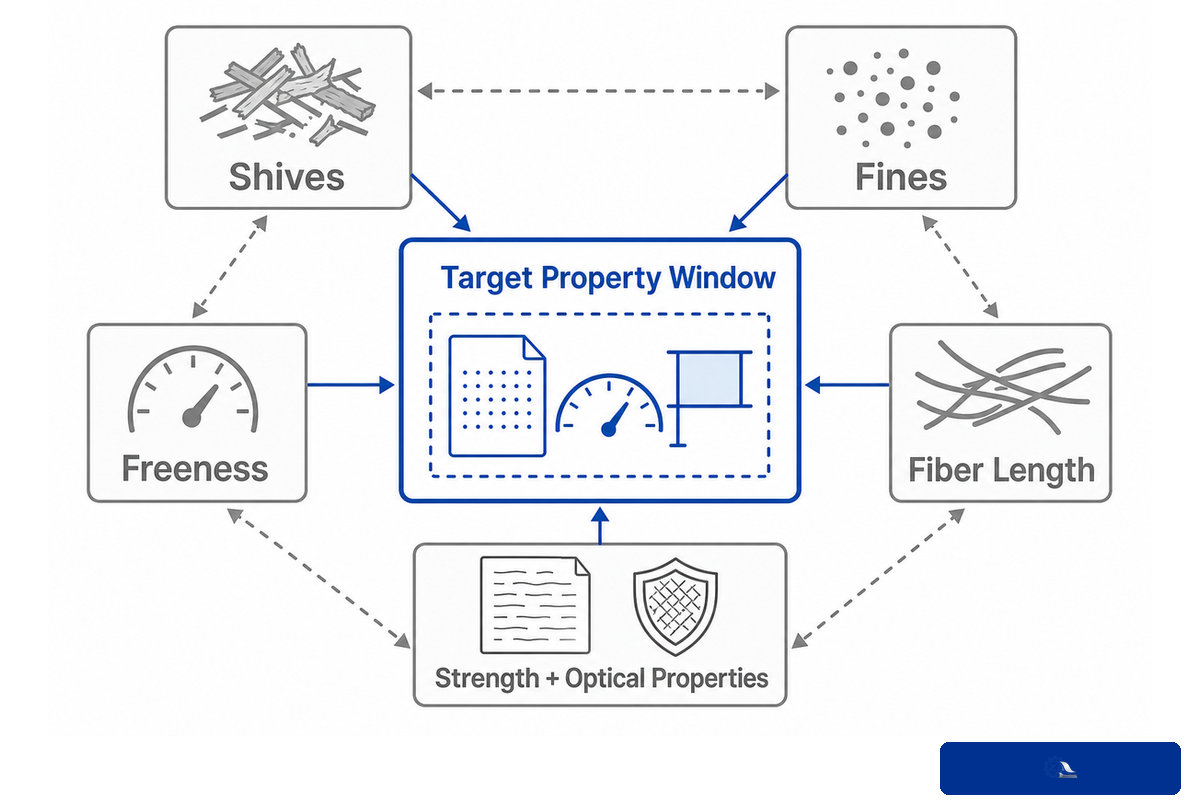
Control note: In production, every pulp-quality trade-off carries a risk: a shift that improves one test result can still create a drainage or strength problem elsewhere.
No pulp measurement is the solution. Shives indicate incompletely separated materials under a stated method. Fines refer to a small particle fraction but don’t indicate whether the particles are useful fibrils or damaging debris. Freeness refers to drainage behavior under a test. Changes in fiber length and morphology indicate population changes. Sheet tests reflect final property balance.
- Shives: Rising shives can be caused by separation, stage loading, or plate condition, and/or screening balance. Hold the laboratory method constant.
- Fines: More fines can support bonding or reduce drainage, depending on their origin and retention.
- Freeness: Decreased freeness doesn’t automatically mean increased strength or decreased quality. Temperature, fines and fiber condition affect the results.
- Fiber length: A decrease can reduce tear reserve, but the final result is dependent on the starting population and the degree of bonding.
- Strength and optical properties: An improvement in one property may come at the expense of bulk, opacity, light scattering, tear or machine drainage.
More energy can produce more fully developed fibers within a defined system, as the BioResources review notes. More energy may not be justified by an unlimited “more is better” rule. Inefficient separation can consume energy, and intensity or stage allocation can change which property moves. Keep the target property window visible beside the energy trend.
How to Diagnose an Unstable or Inefficient TMP Refiner
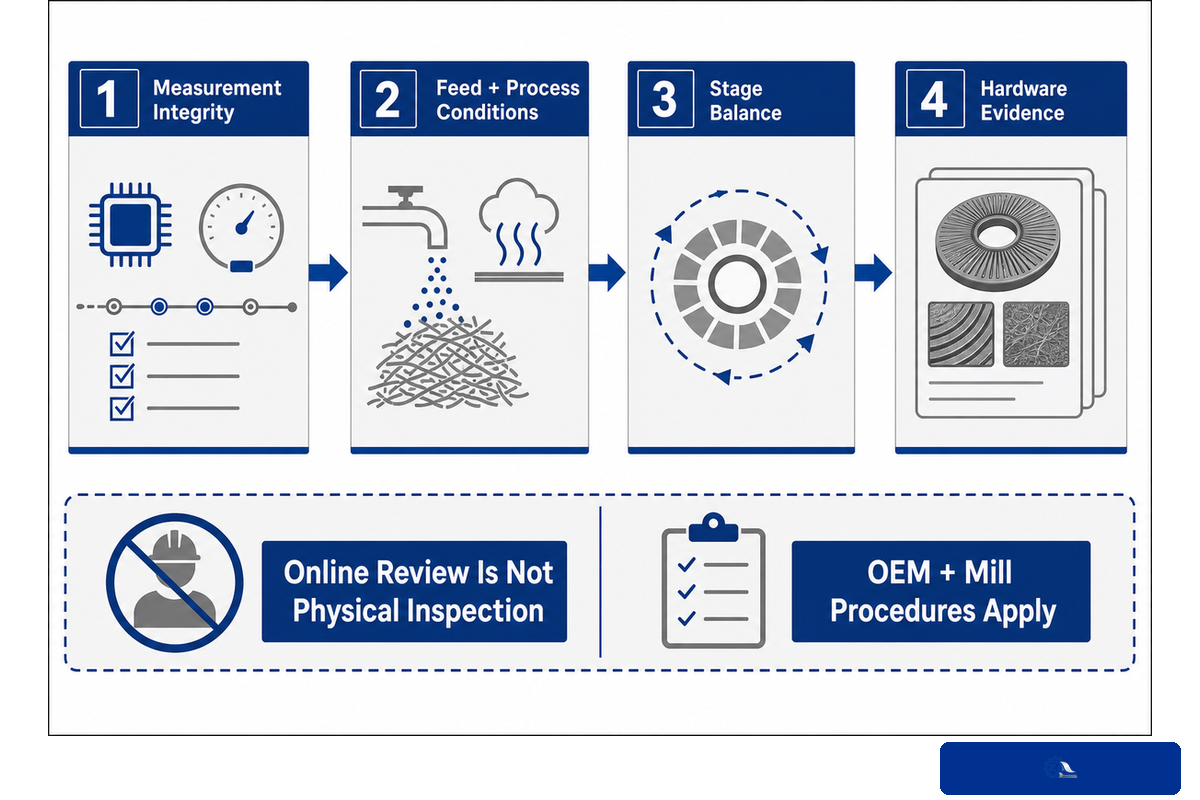
Diagnosis should move from measurement integrity to feed and process conditions, then to stage balance and hardware. Reversing this order may lead to changing plates to solve a denominator, sample or upstream problem.
- Match process and sample time. Match the change time with the pulp that actually reached the sample point. Verify timestamp synchronization, power scaling, pressure/temperature position, gap feedback and consistency sampling.
- Rebuild dry production. Verify the basis of the flow and dry-solids used in the energy calculation.
- A complete chip lot needs to be reviewed. Compare species, moisture content, size distribution and contamination levels against the accepted baseline.
- Review steam conditioning. Look for pressure, temperature, residence and/or feeding changes prior to the primary stage.
- Separate stage loads. Separate primary, secondary, reject and LC loads instead of relying on one total. “Power went up” is an observation, not a root cause.
- Align the sample. Match the change time with the pulp that actually reached the sample point.
- Make a single, bounded change with the dominant inputs as steady as possible and define stop conditions in advance.
- Obtain hardware evidence. Use vibration, wear, deposits, damage, gap response and reproducibility together.
Safety boundary: Online observations and trend assessments aren’t true physical inspections. The TMP refiner is rotating, powered and pressurized. Don’t open, clean, enter, contact the gap or work on plates while hazardous energy remains. The exact isolation sequence belongs to the machine manual and the mill’s lockout/tagout, guarding and permit procedures.
Useful failure reports state what changed, which signals moved first, which stayed stable, what sample represents the new condition, and whether returning to baseline reproduced or removed the problem. “Power went up” is an observation, not the root cause.
A Controlled Trial and Technical Handoff Checklist
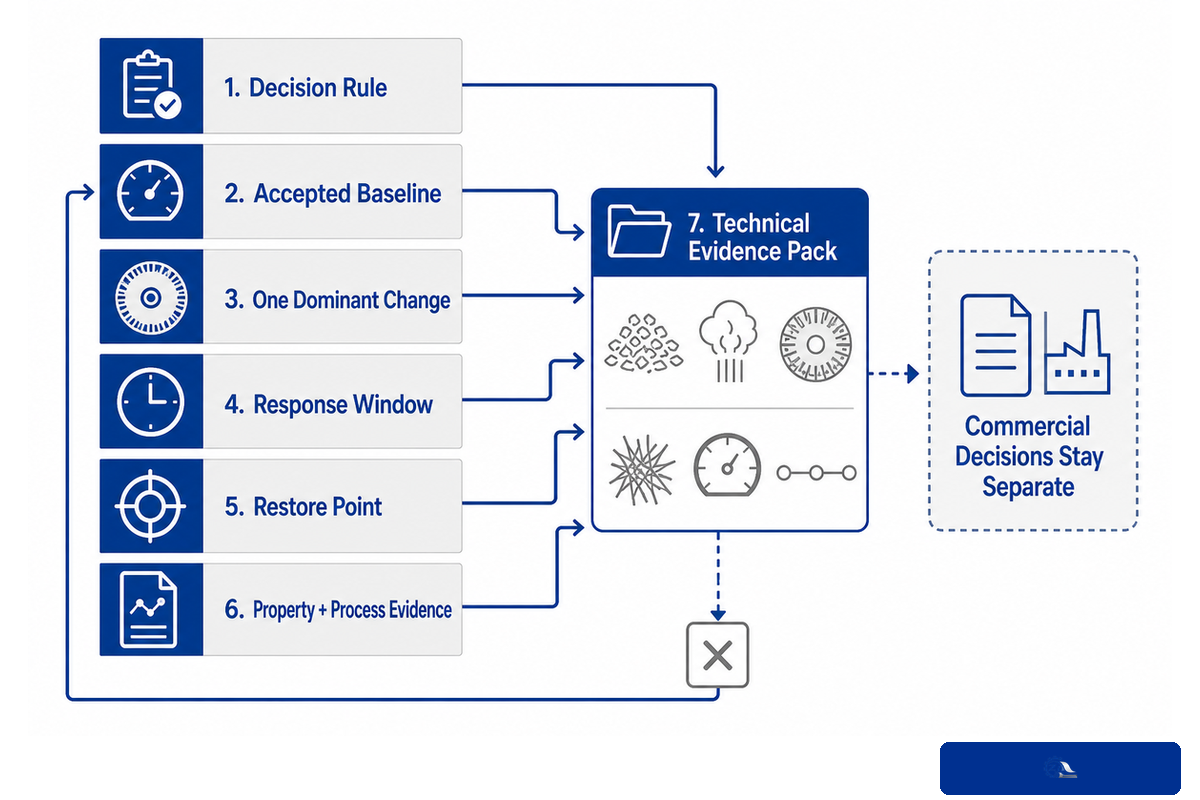
Controlled changes start with a decision rule and accepted baseline. Decide the property to be improved and the limits that protect the grade. Define the single dominant change, the response window and restore point. Don’t stack gap, dilution and steam changes before the first new sample reaches the laboratory.
Asset 5: Controlled Trial and Technical Handoff Checklist
- Machine make/model, stage duty, rotation, speed and current plate drawing
- Chip species, size, moisture and time window for test batch
- Gross power, validated no-load basis, oven-dry rate and auxiliary loads
- Preheater pressure/temperature, dilution, consistency and gap trend
- Plate service hours, clear wear photos, deposits, damage and contact marks
- Shive method, freeness, fiber length/fines and selected sheet properties
- Change timestamp, known transport/sample delay, restore point and result
This checklist ends with the technical evidence pack. It doesn’t provide rankings on plate models, materials, suppliers, price or lead time. Separate commercial decisions will be made on these. When evidence suggests a need to understand the condition of plates or comparison with other plates, use the refiner plates and screen baskets for fit, material and quotation.
For information on company background and manufacturing scope, please refer to Zejiang Paper Machinery.
For project-level context beyond the refiner, review Zejiang’s pulp and paper solutions.
Frequently Asked Questions
What does TMP stand for in a paper mill?
TMP stands for thermomechanical pulping. Prepared wood chips are heated with steam and mechanically refined so bundles separate and fibers develop. The term describes a process line, not one universal machine arrangement. A TMP line may use primary and secondary high-consistency refiners, screening, reject treatment, steam recovery and sometimes low-consistency post-refining. Confirm the feed and duty of each refiner before comparing settings.
How is TMP refiner energy calculated?
First name the boundary. Gross motor energy describes the drive load. Net specific refining energy commonly subtracts a declared no-load power and divides by oven-dry production. A whole-process comparison may also include feeders, pumps, screens and useful recovered heat. Keep the no-load test, dry-flow method and time window consistent. Never compare net refiner energy with total process energy without reconciling the boundary. When a report credits recovered steam, state the consumer, pressure, time match and useful heat calculation. When it includes auxiliary equipment, list the motors rather than hiding them inside one number. That makes a before-and-after comparison repeatable.
Does a lower freeness mean the TMP refiner is working better?
Not by itself. Freeness measures drainage response under a defined test. Fines, temperature, fiber morphology and furnish can change the result. A lower value may accompany useful development, excessive fiber damage or simply a different sample condition. Read it with shives, fiber length, fines and relevant sheet properties, and make sure the sample represents the process setting you’re evaluating.
When should a mill replace TMP refiner plates?
Don’t use hours alone. Investigate replacement when repeatable operating evidence links wear, damage, deposits, abnormal vibration, gap response or performance drift to the plate condition after feed, dry rate, energy basis and sampling delay are checked. Follow the OEM and site isolation procedure for inspection. Give the supplier clear dimensions, pattern evidence, wear photos, stage duty and time-aligned process and pulp results. Retain the removed segments when practical, label their positions, and photograph both sides before cleaning evidence away. A paired record of plate condition and operating data is much stronger than an isolated wear photo. If the problem disappears after a controlled return to baseline, record that result before selecting replacement geometry.
References & Sources
- BioResources: Effects of wood quality and refining process on TMP pulp and paper quality
- Applied Sciences: Effects of refiner plates with different fillings on TMP properties
- PMC: Theoretical analysis of LC refining and pressure-screening systems in TMP
- KTAPPI: Effect of plate patterns on TMP refining performance
- BioResources: Time-series analysis of refining conditions and estimated pulp properties
- TAPPI: Updates to Useful Methods
- OSHA 1910.261: pulp, paper and paperboard mills
Technical content was compared against peer-reviewed literature, government, industry-association and current process sources. Operating limits and isolation steps remain specific to the installed equipment, furnish and mill procedures.




![Refiner Plates & Screen Baskets [Complete Guide]](https://zjpapermachine.com/wp-content/uploads/2026/07/refiner-plates-screen-baskets-guide-featured-150x150.png)
![Doctor Blade: Types, Materials & How It Works [Guide]](https://zjpapermachine.com/wp-content/uploads/2026/07/doctor-blade-guide-featured-1-150x150.png)
![Pulping Equipment: How Paper Pulping Works [Guide]](https://zjpapermachine.com/wp-content/uploads/2026/07/pulping-equipment-guide-featured-150x150.png)